Fig. 11
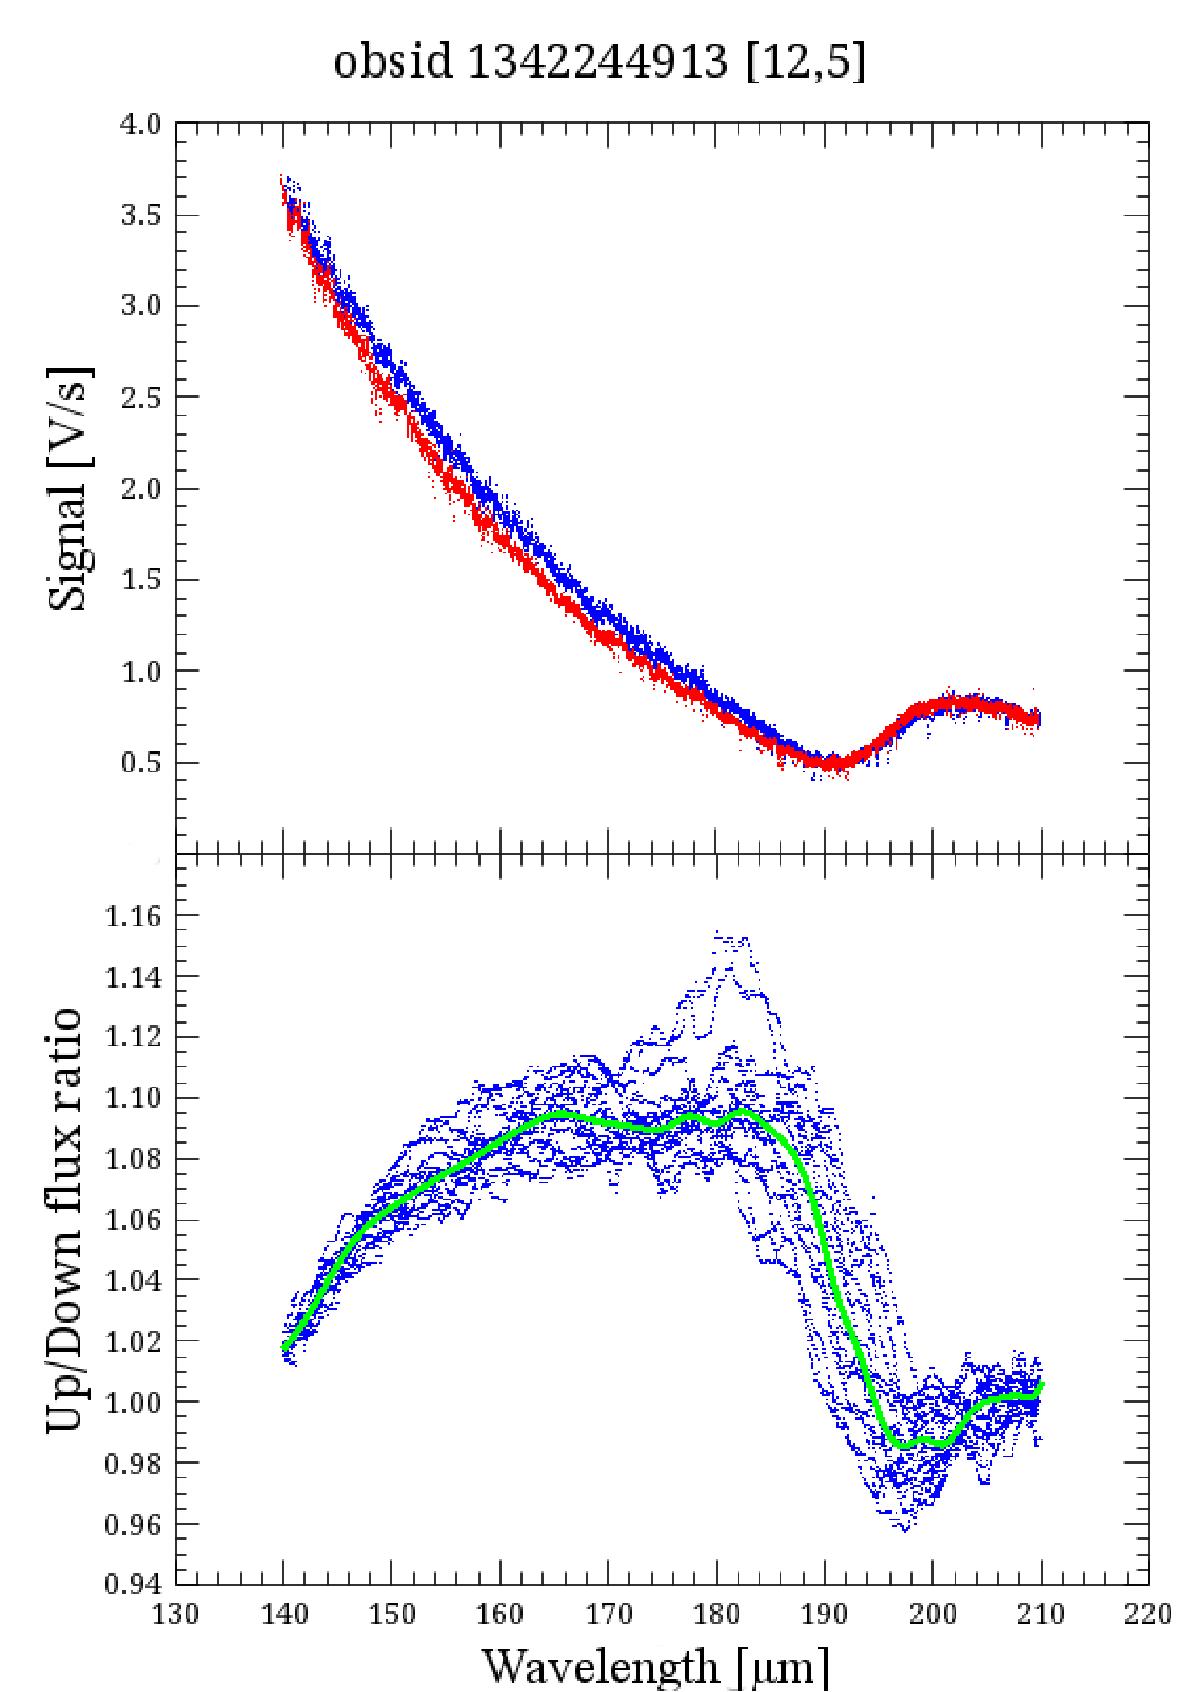
Top panel: flux in the up-scan (blue) compared to the flux in the down-scan (red). When the incident flux is decreasing (blue line between 140 and 195 μm) the measured flux is higher than that measured when the flux is increasing (red line in the same wavelength region). The situation is inverted between 195 and 205 μm, while the two fluxes are very similar in the wavelength region beyond 205 μm where there is no big variation in flux. Bottom panel: ratio between up- and down-scan measured fluxes for all the 16 pixel in a space module. The behaviour is very similar.
Current usage metrics show cumulative count of Article Views (full-text article views including HTML views, PDF and ePub downloads, according to the available data) and Abstracts Views on Vision4Press platform.
Data correspond to usage on the plateform after 2015. The current usage metrics is available 48-96 hours after online publication and is updated daily on week days.
Initial download of the metrics may take a while.