Fig. 4
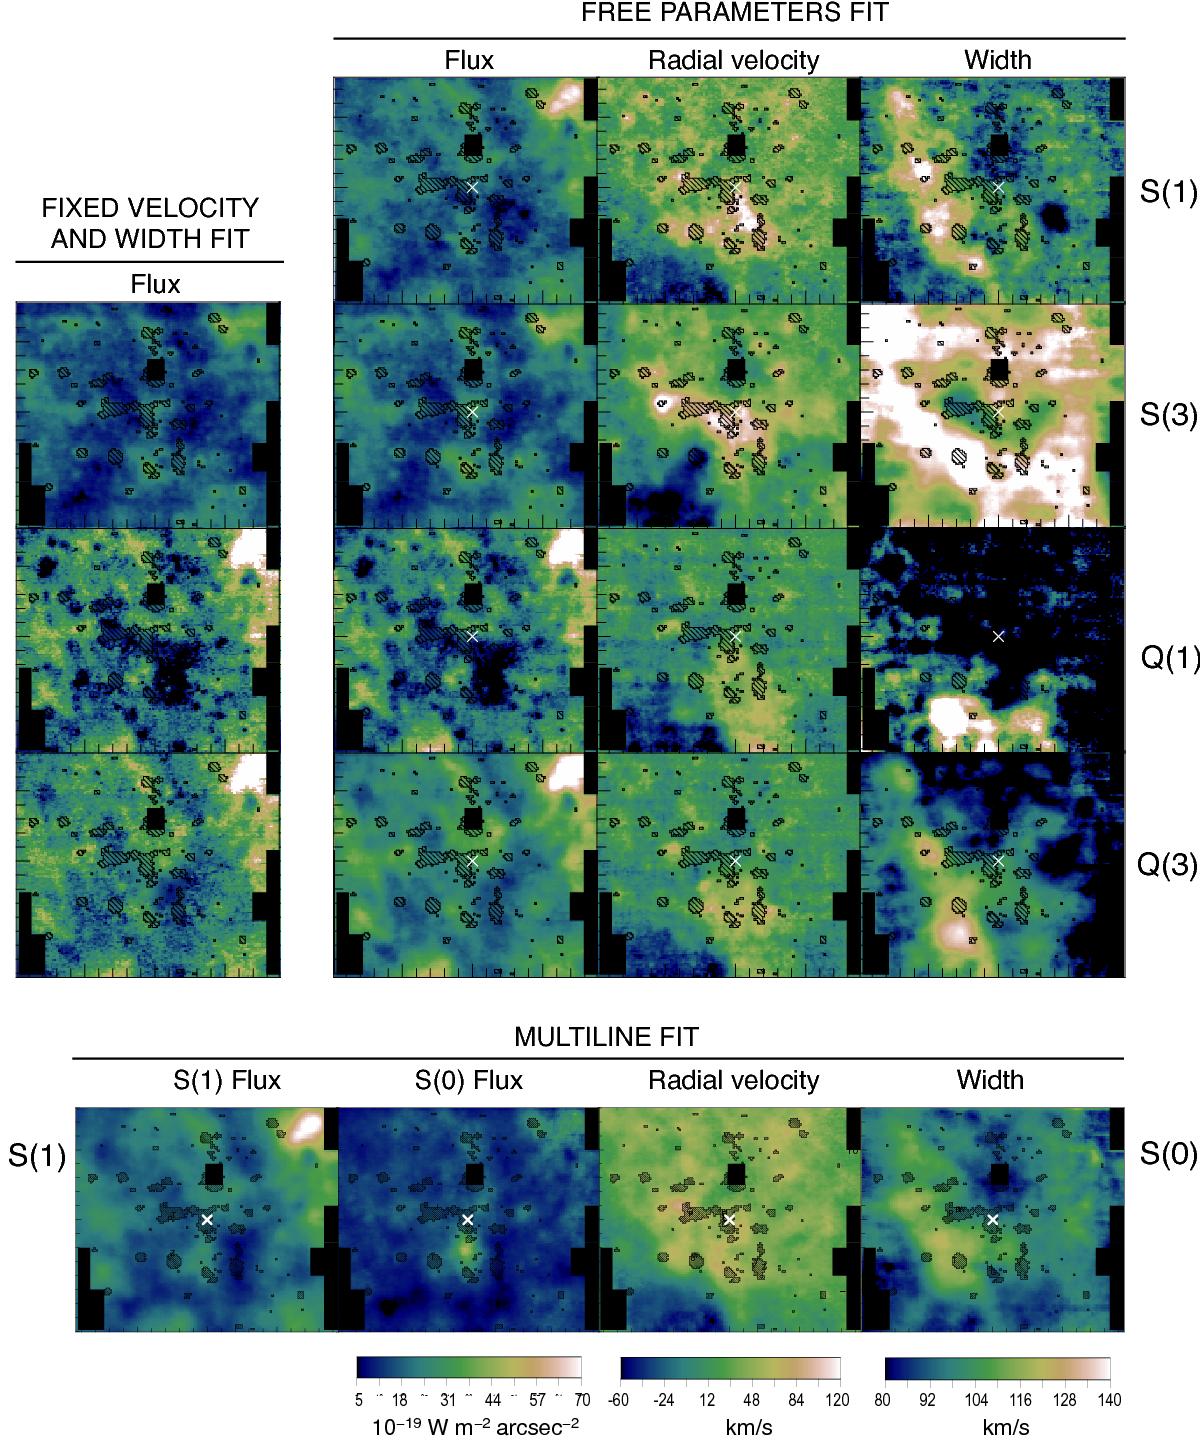
Parameter maps for each ortho line. Left to right: flux with velocity and width imposed to be those of S(1) line. Line flux, velocity, and width with free parameters. Top to bottom: 1−0 S(1), S(3), Q(1), and Q(3) lines plus the 1−0 S(0) line maps obtained with the multiline fit. Maps are centered on Srg A*. The color bars are the same for all lines and as in Fig. 2. Symbols as in Fig. 2.
Current usage metrics show cumulative count of Article Views (full-text article views including HTML views, PDF and ePub downloads, according to the available data) and Abstracts Views on Vision4Press platform.
Data correspond to usage on the plateform after 2015. The current usage metrics is available 48-96 hours after online publication and is updated daily on week days.
Initial download of the metrics may take a while.