Fig. 3
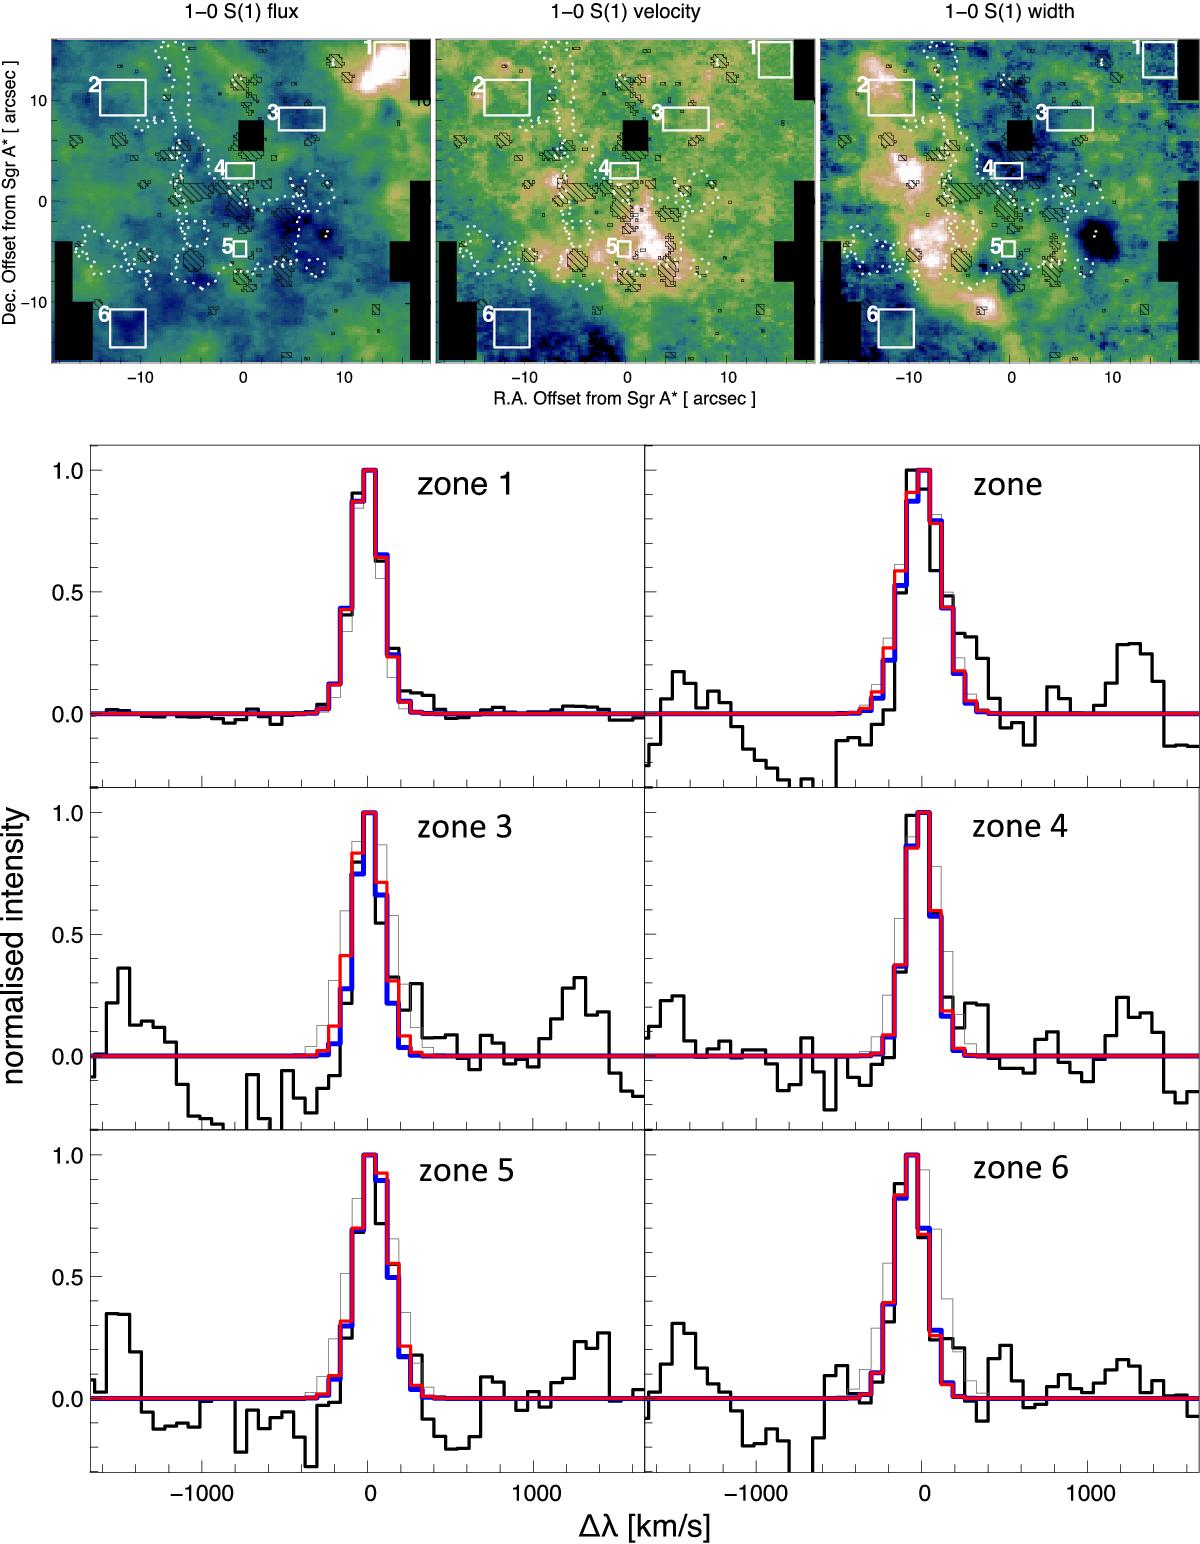
Top: zones where individual spectra of S(1) line, have been extracted, superimposed on parameters maps (the same as in Fig. 2). Bottom: for each zone the normalized average spectrum (black) is superimposed on the respective pixel by pixel 1D model (solid blue) and regularized 3D model (solid red). The gray line reproduces another solution of the regularized 3D fitting. Both solutions have close values of χ2 (1.15 and 1.49, respectively), but the red model fits the observations much better.
Current usage metrics show cumulative count of Article Views (full-text article views including HTML views, PDF and ePub downloads, according to the available data) and Abstracts Views on Vision4Press platform.
Data correspond to usage on the plateform after 2015. The current usage metrics is available 48-96 hours after online publication and is updated daily on week days.
Initial download of the metrics may take a while.