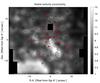
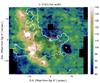
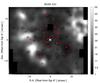
Fig. 2
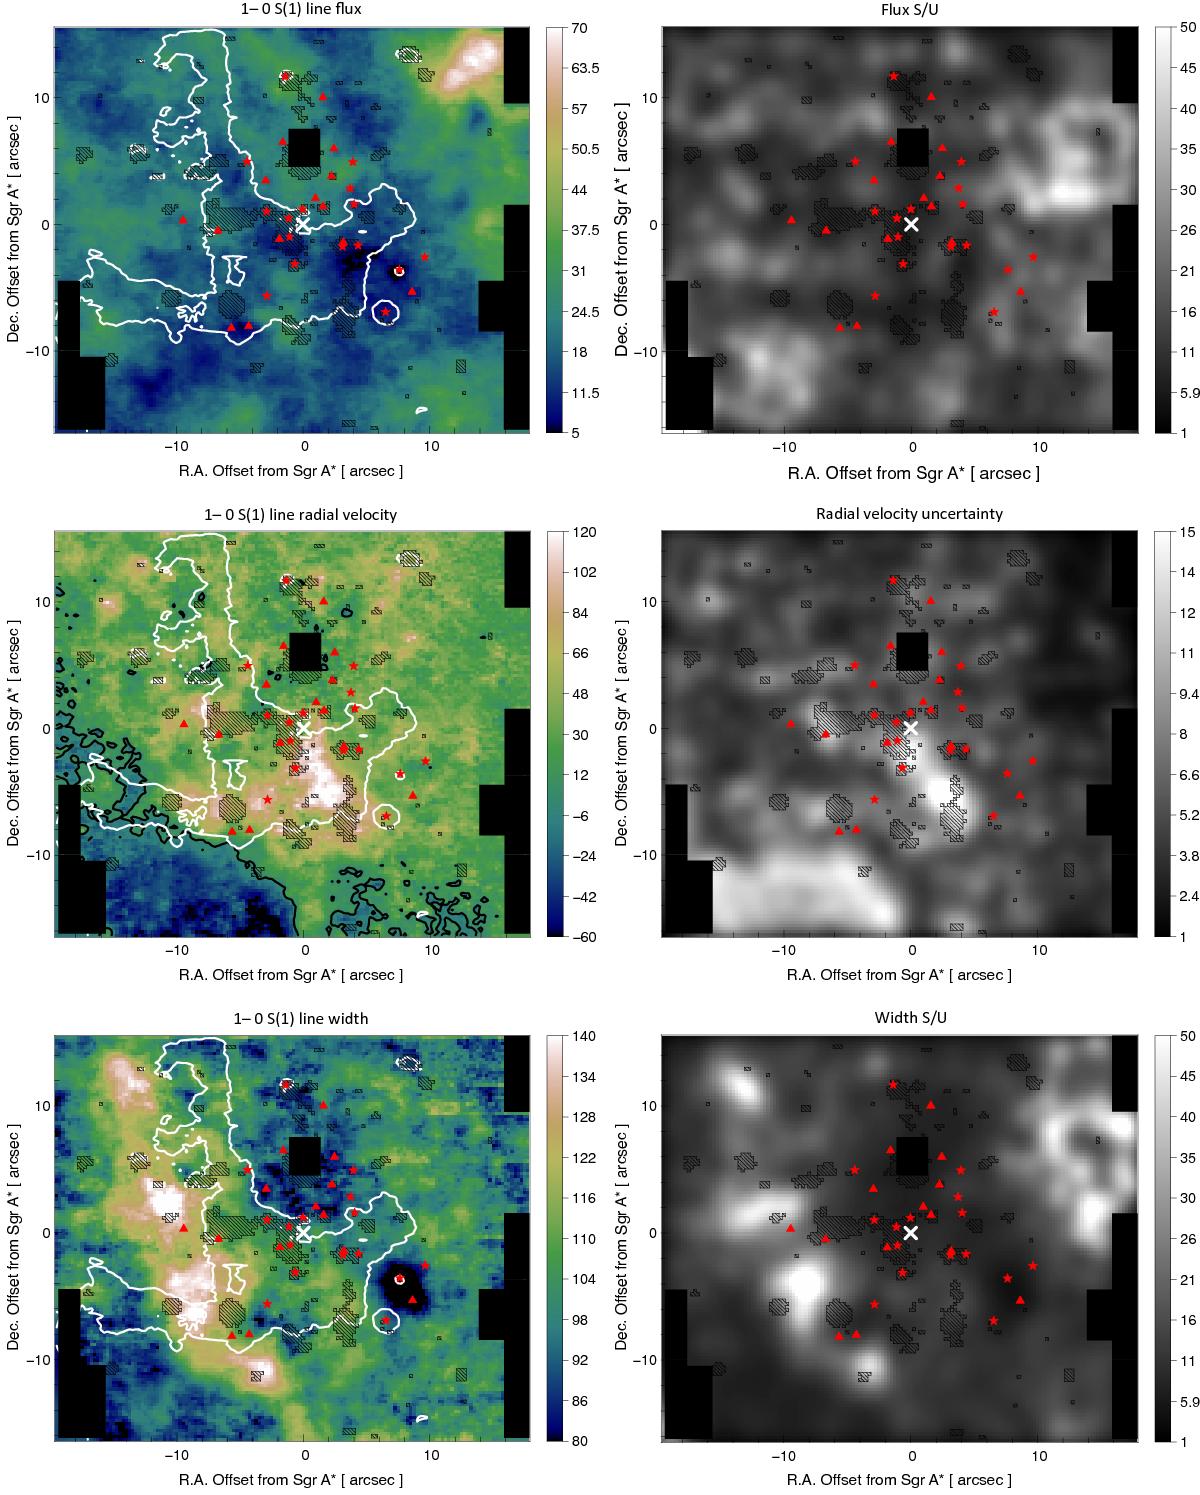
Left: parameter maps of the 1−0 S(1) line obtained through regularized 3D fitting. Sgr A* is indicated by the cross. The line flux color bar is in 10-19 W m-2 arcsec-2. Velocity and width color bars are in km s-1. The white contour traces the Brγ emission of the minispiral at 2 × 10-16 W m-2 arcsec-2. The dashed areas cover stars zones that have been interpolated. Red dots indicate the position of Wolf-Rayet stars: stars show type WN and triangles type WC (Paumard et al. 2006 catalog). The solid black areas indicate regions of which we lack observations. GCIRS 7 is covered by the central black square. The solid black line in the velocity maps indicates points at zero velocity. Right: signal-to-uncertainty ratio (S/U) maps for flux and width maps, uncertainty map for velocity.
Current usage metrics show cumulative count of Article Views (full-text article views including HTML views, PDF and ePub downloads, according to the available data) and Abstracts Views on Vision4Press platform.
Data correspond to usage on the plateform after 2015. The current usage metrics is available 48-96 hours after online publication and is updated daily on week days.
Initial download of the metrics may take a while.