Fig. 8
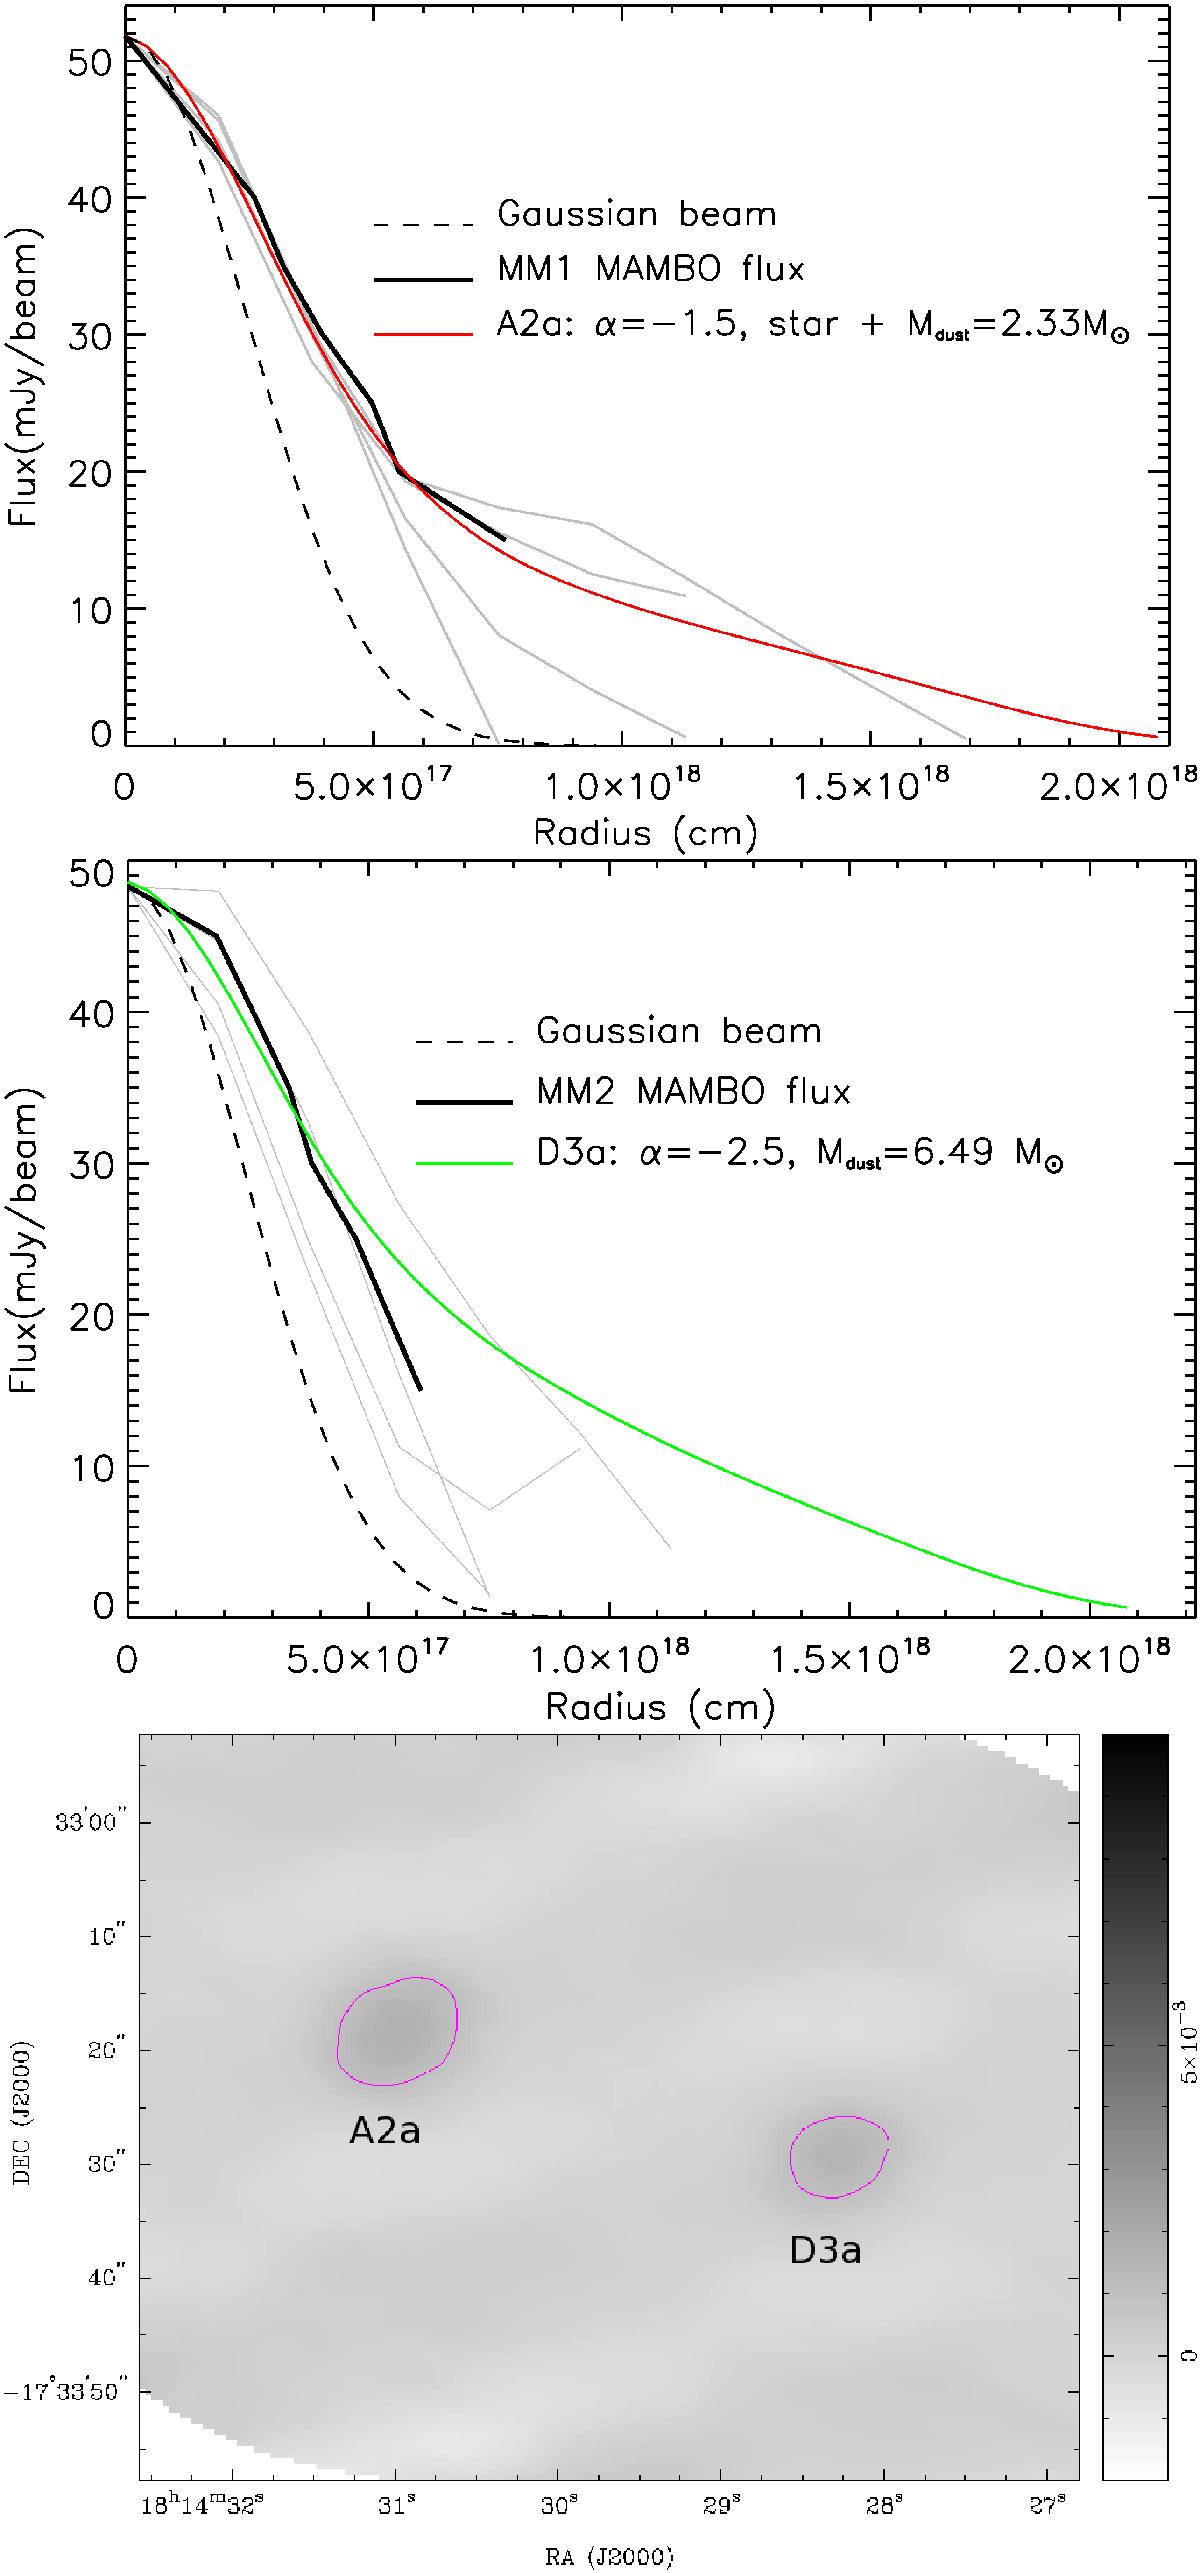
CASA simulated SMA 1.3 mm continuum map of the SDC13 region (bottom) made using RADMC-3D models A2a (top) and D3a (centre; see Table 4). The map contour is at 1.5 mJy. The rms noise in the centre of the map ~0.09 mJy. Model fluxes for A2a (shown in red) and D3a (shown in green) are compared with plots of the observed MAMBO 1.2 mm flux against equivalent radius for MM1 and MM2 respectively (solid black lines). Model parameters are given in the key of each plot. The grey lines in the top two plots indicate perpendicular slices of observed flux against radius; these slices give an indication of the range of variation in the observed flux distributions in MM1 and MM2. The dashed curves indicate the MAMBO beam (FWHM = 10.7′′).
Current usage metrics show cumulative count of Article Views (full-text article views including HTML views, PDF and ePub downloads, according to the available data) and Abstracts Views on Vision4Press platform.
Data correspond to usage on the plateform after 2015. The current usage metrics is available 48-96 hours after online publication and is updated daily on week days.
Initial download of the metrics may take a while.