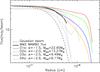
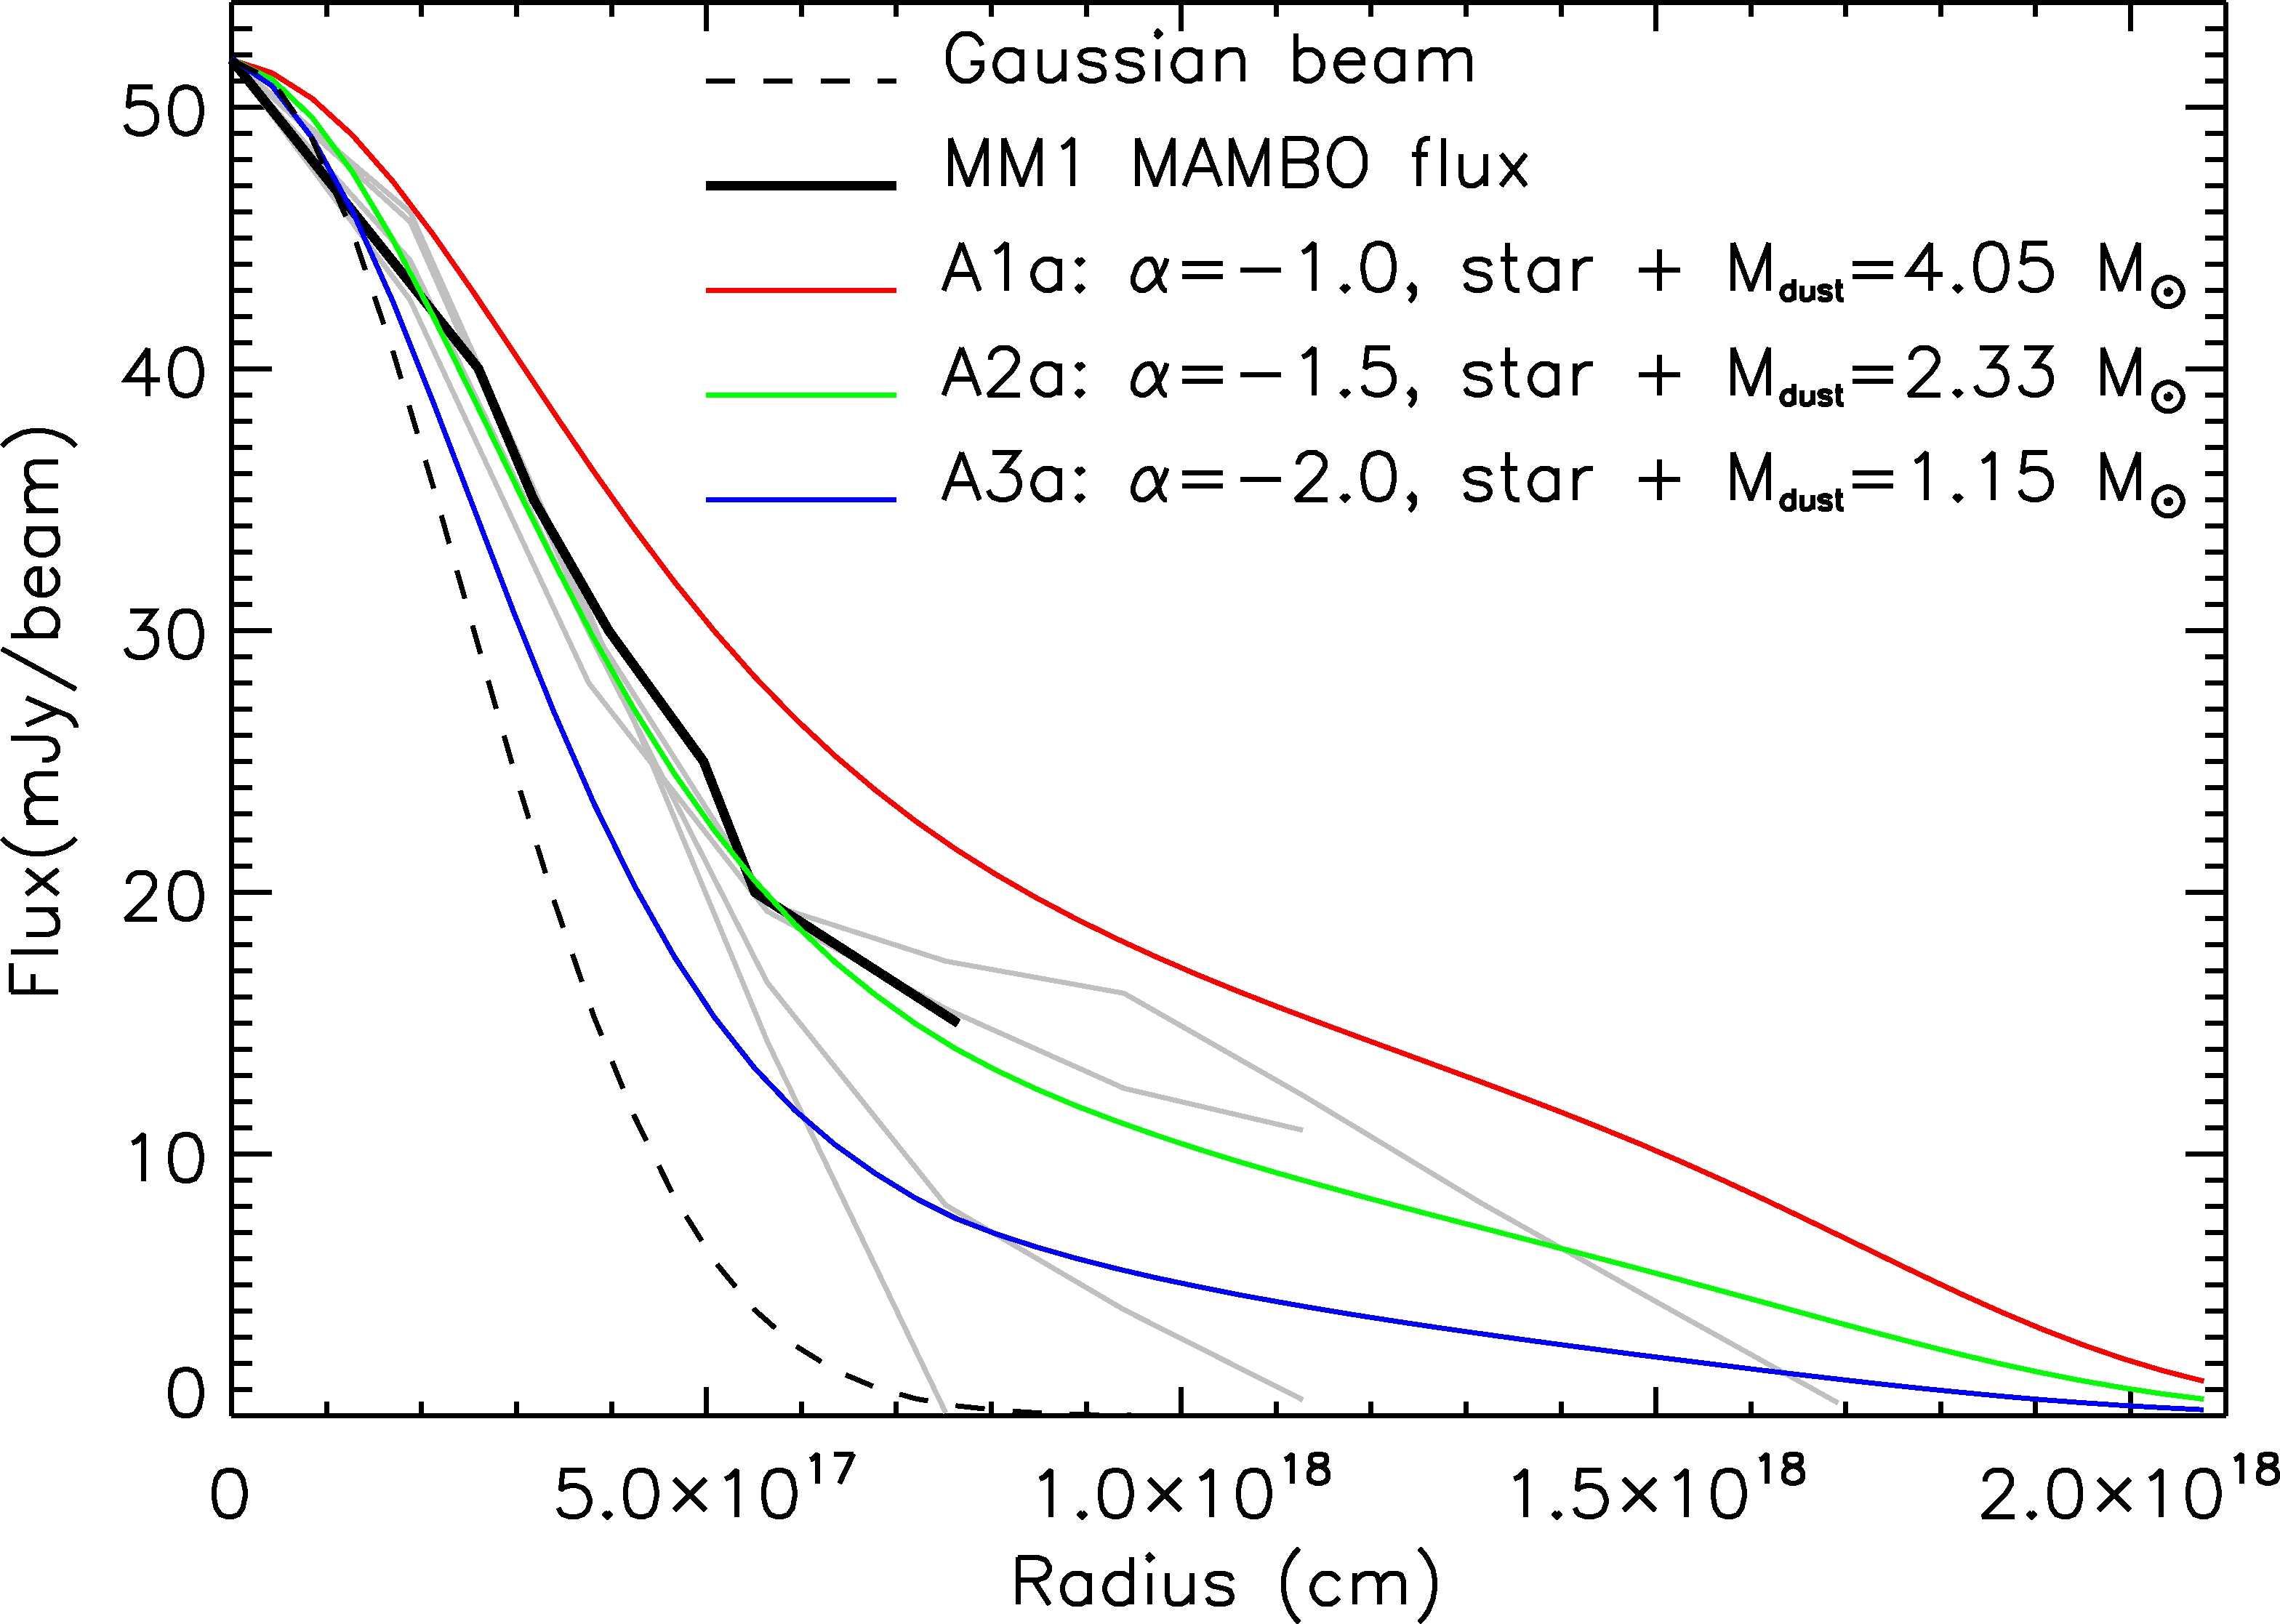
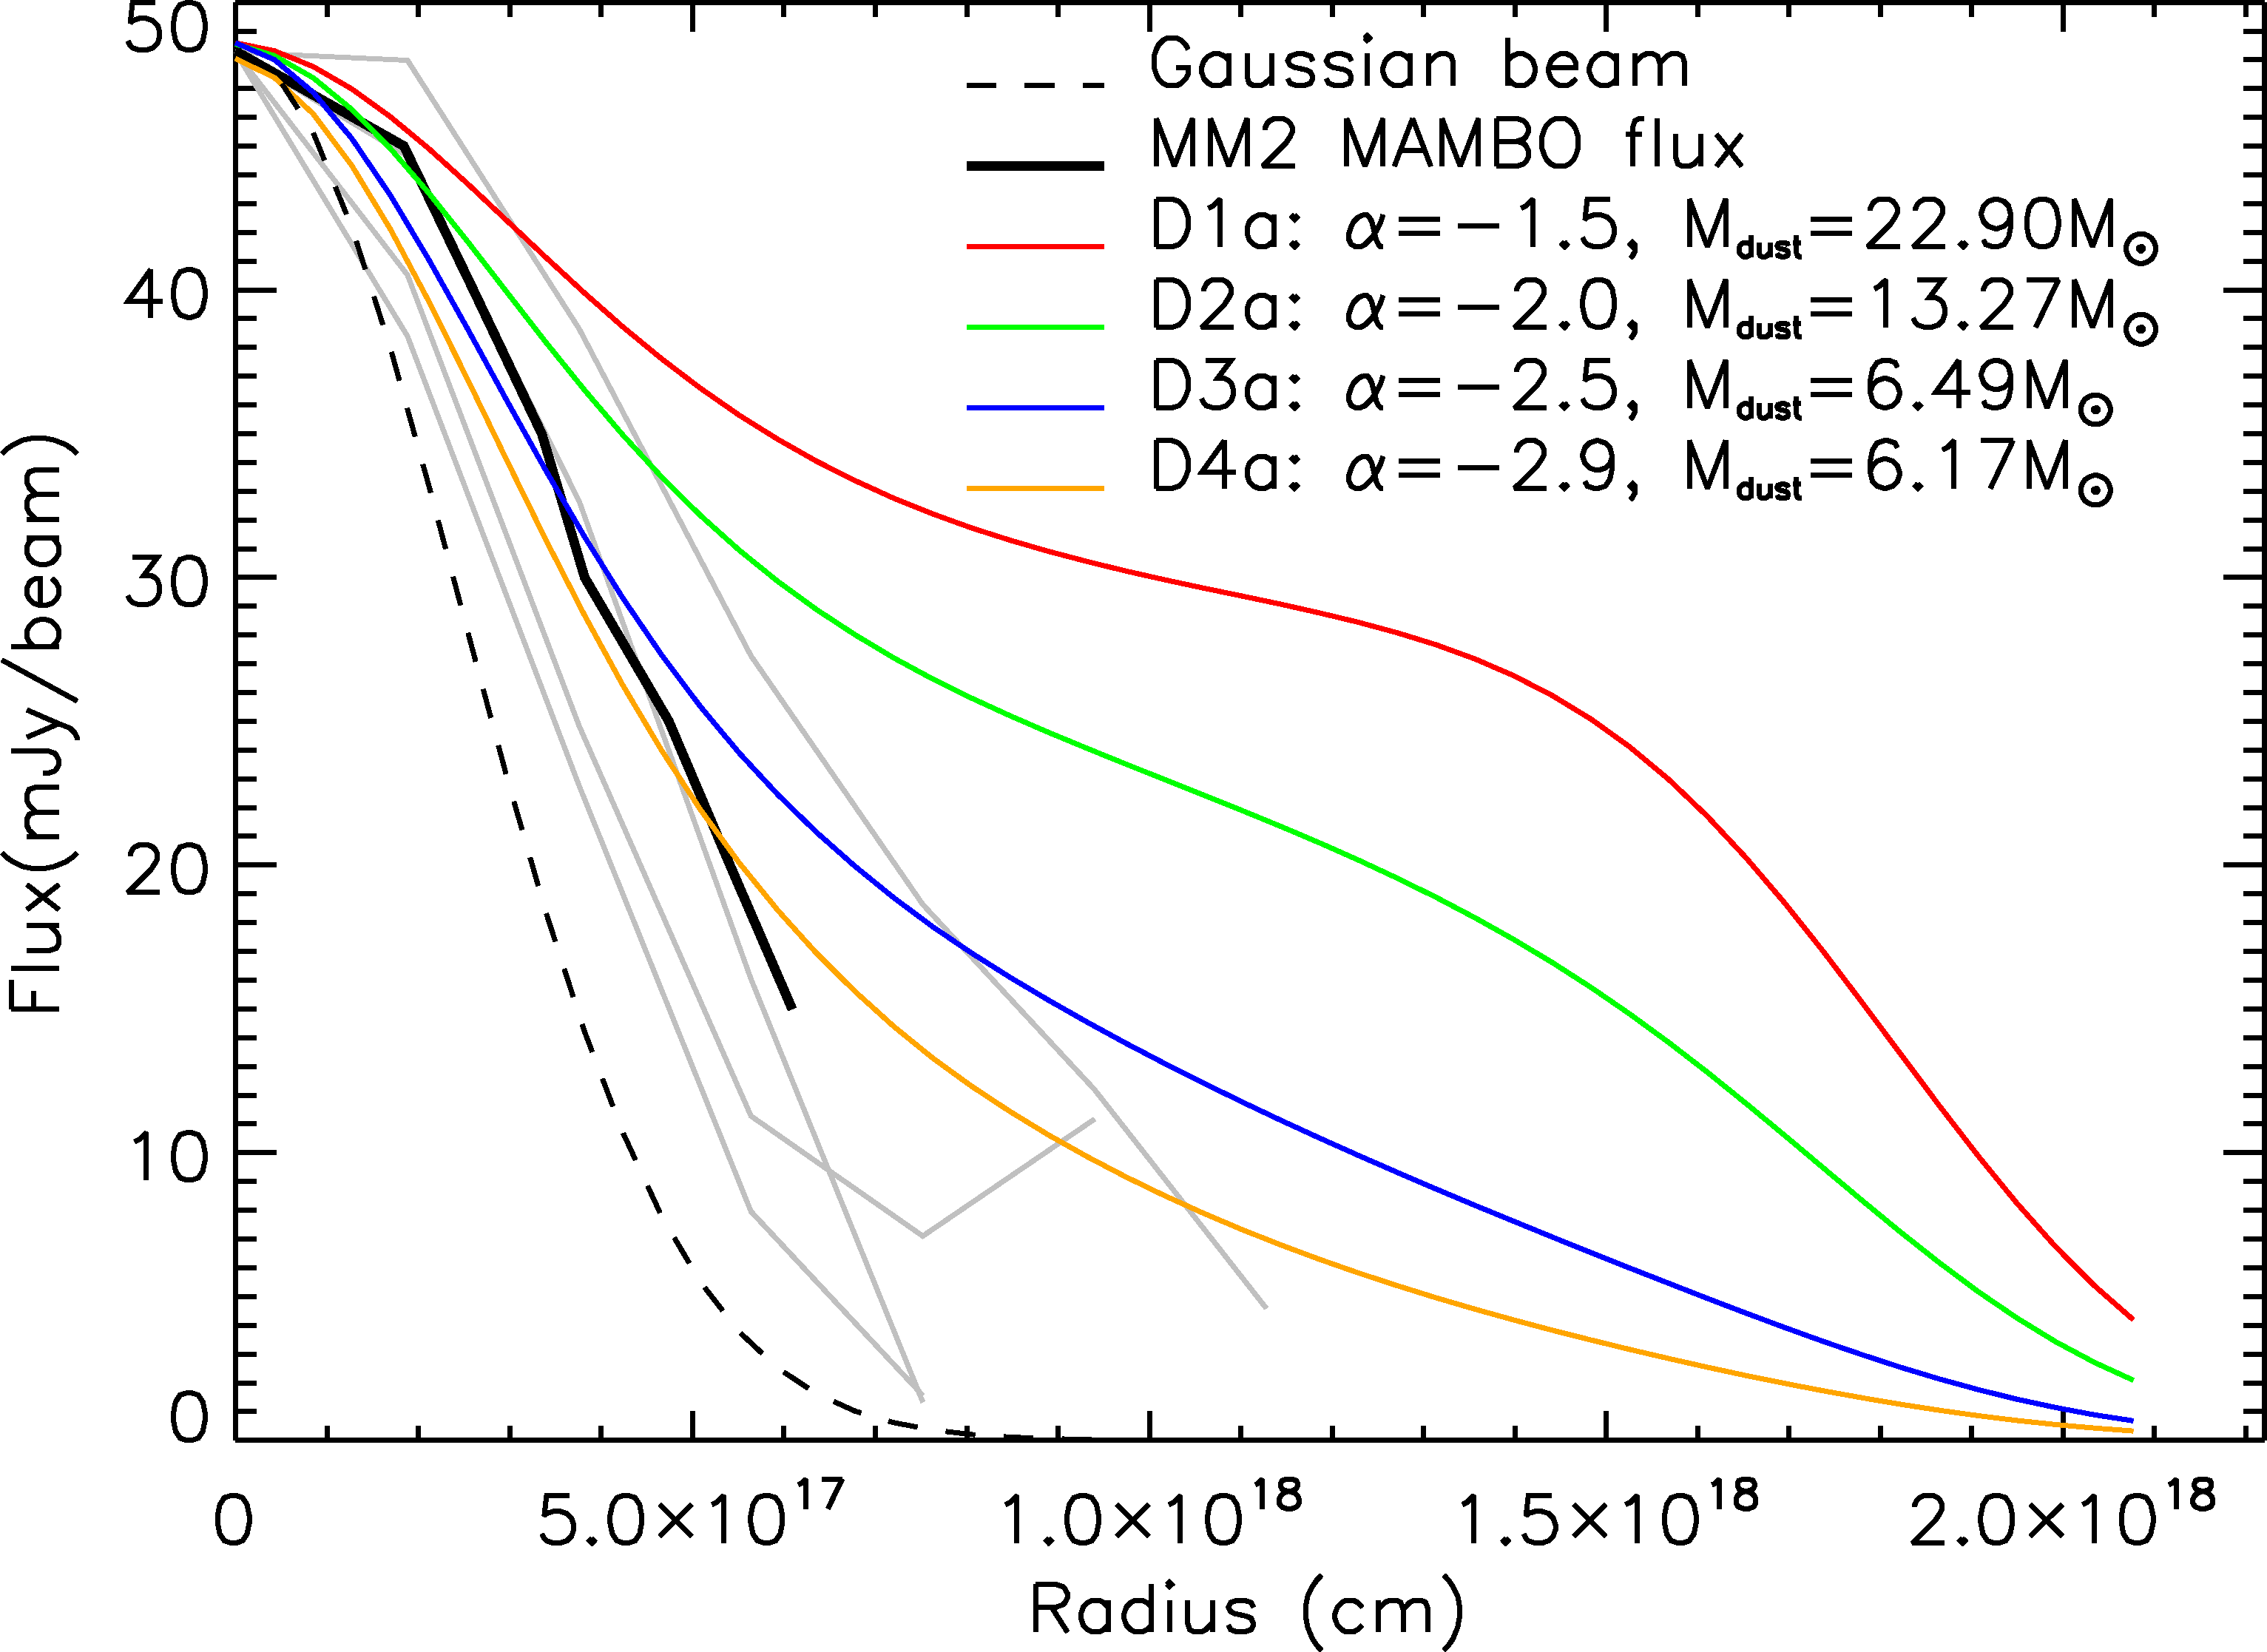
Fig. 6
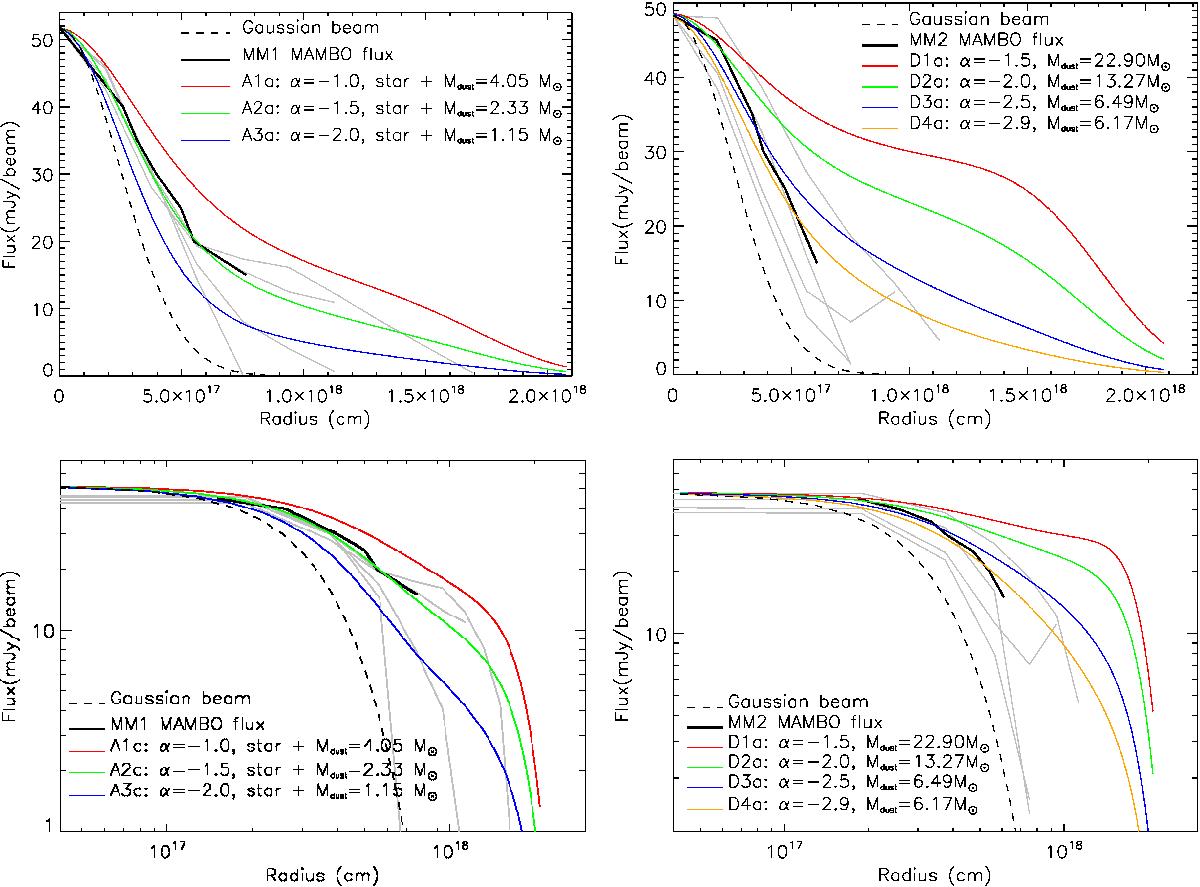
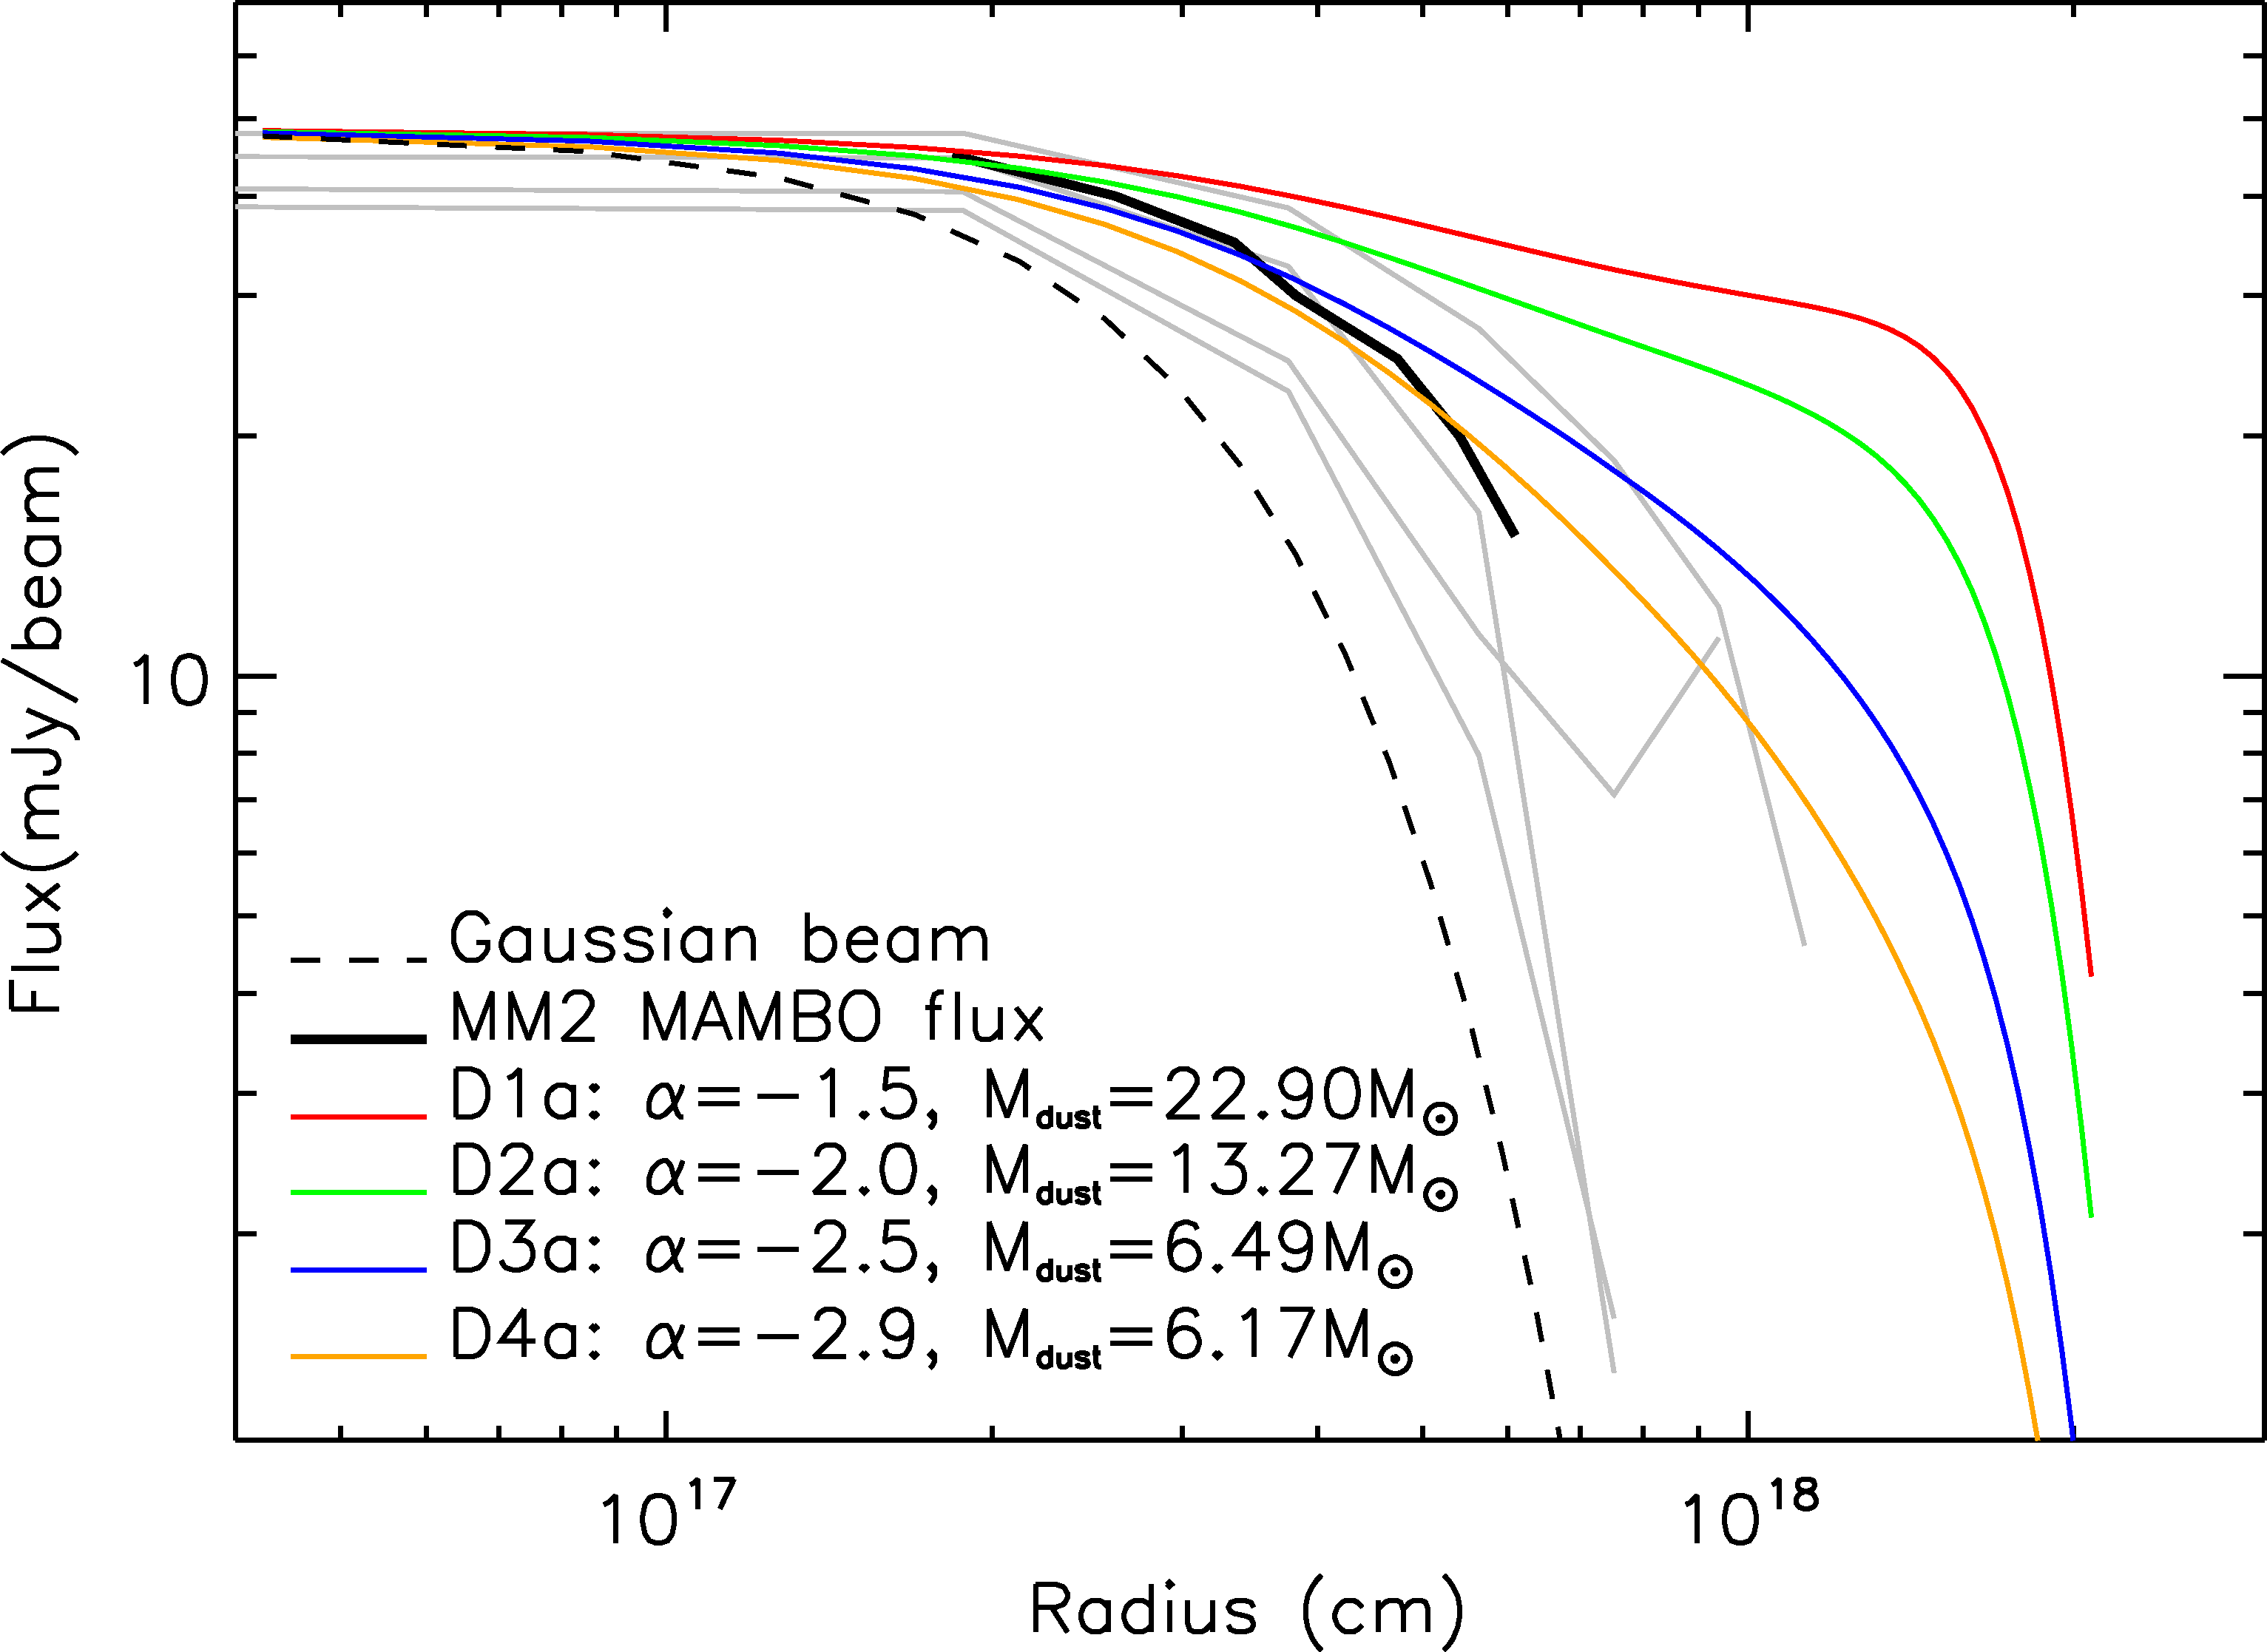
Comparison of the observed MAMBO 1.2 mm flux distributions of MM1 (left) and MM2 (bottom) with RADMC-3D model fluxes, obtained using various model parameters. The solid black lines indicate the observed fluxes plotted against the equivalent radius ![]() (where Anσ is the area contined within contours nσ, for n = 3, 4, 6, 7, 8, 9 and σ ~ 5 mJy/beam). The grey lines indicate perpendicular slices of observed flux against radius; these slices give an indication of the range of variation in the observed flux distributions in MM1 and MM2. The coloured lines show the model fluxes against radius for RADMC-3D models with various dust distributions, as indicated in the key. The model dust masses Mdust required to match each peak model flux with the peak observed flux are also given. Models are labelled A1a to A3a (for those fit to MM1 data) and D1a to D4a (for those fit to MM2 data). The dashed curves indicate the MAMBO beam (10.7′′).
(where Anσ is the area contined within contours nσ, for n = 3, 4, 6, 7, 8, 9 and σ ~ 5 mJy/beam). The grey lines indicate perpendicular slices of observed flux against radius; these slices give an indication of the range of variation in the observed flux distributions in MM1 and MM2. The coloured lines show the model fluxes against radius for RADMC-3D models with various dust distributions, as indicated in the key. The model dust masses Mdust required to match each peak model flux with the peak observed flux are also given. Models are labelled A1a to A3a (for those fit to MM1 data) and D1a to D4a (for those fit to MM2 data). The dashed curves indicate the MAMBO beam (10.7′′).
Current usage metrics show cumulative count of Article Views (full-text article views including HTML views, PDF and ePub downloads, according to the available data) and Abstracts Views on Vision4Press platform.
Data correspond to usage on the plateform after 2015. The current usage metrics is available 48-96 hours after online publication and is updated daily on week days.
Initial download of the metrics may take a while.