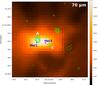
Fig. 5
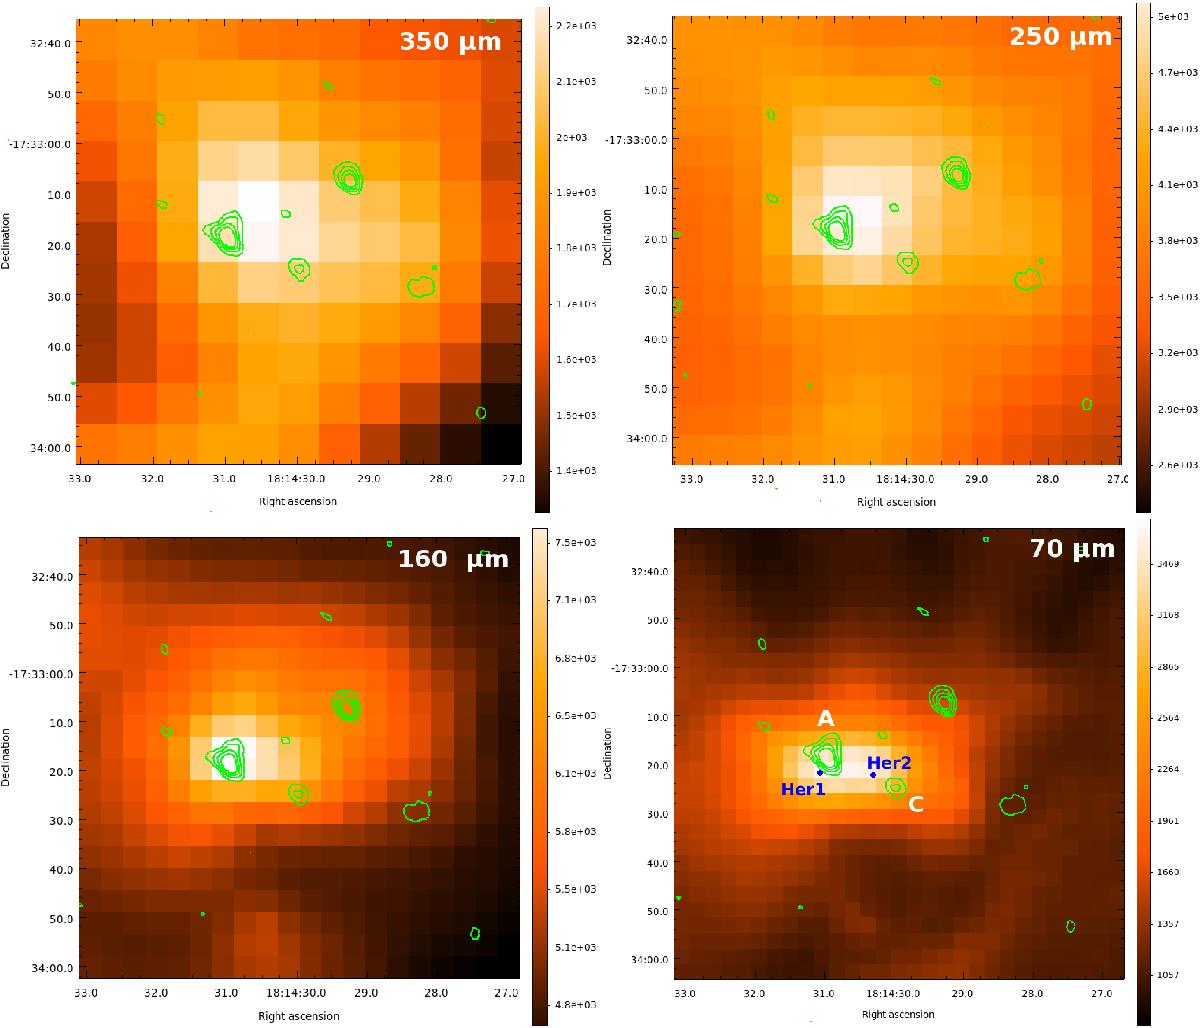
SMA 1.3 mm continuum data overlayed on Herschel Hi-GAL images (Jy/beam) at 350 μm (top left), 250 μm (top right), 160 μm (bottom left) and 70 μm (bottom right). The contours indicate the SMA 1.3 mm continuum at 3, 5, 7 and 9 mJy/beam. Letters A and C indicate 2 of the 4 sub-fragments seen in the region which coincide with MM1. The two sources, Her1 and Her2, indicated in blue, were extracted from the 70 μm Herschel data using the Hyper algorithm (Traficante et al. 2015, see Table 3).
Current usage metrics show cumulative count of Article Views (full-text article views including HTML views, PDF and ePub downloads, according to the available data) and Abstracts Views on Vision4Press platform.
Data correspond to usage on the plateform after 2015. The current usage metrics is available 48-96 hours after online publication and is updated daily on week days.
Initial download of the metrics may take a while.