Fig. 3
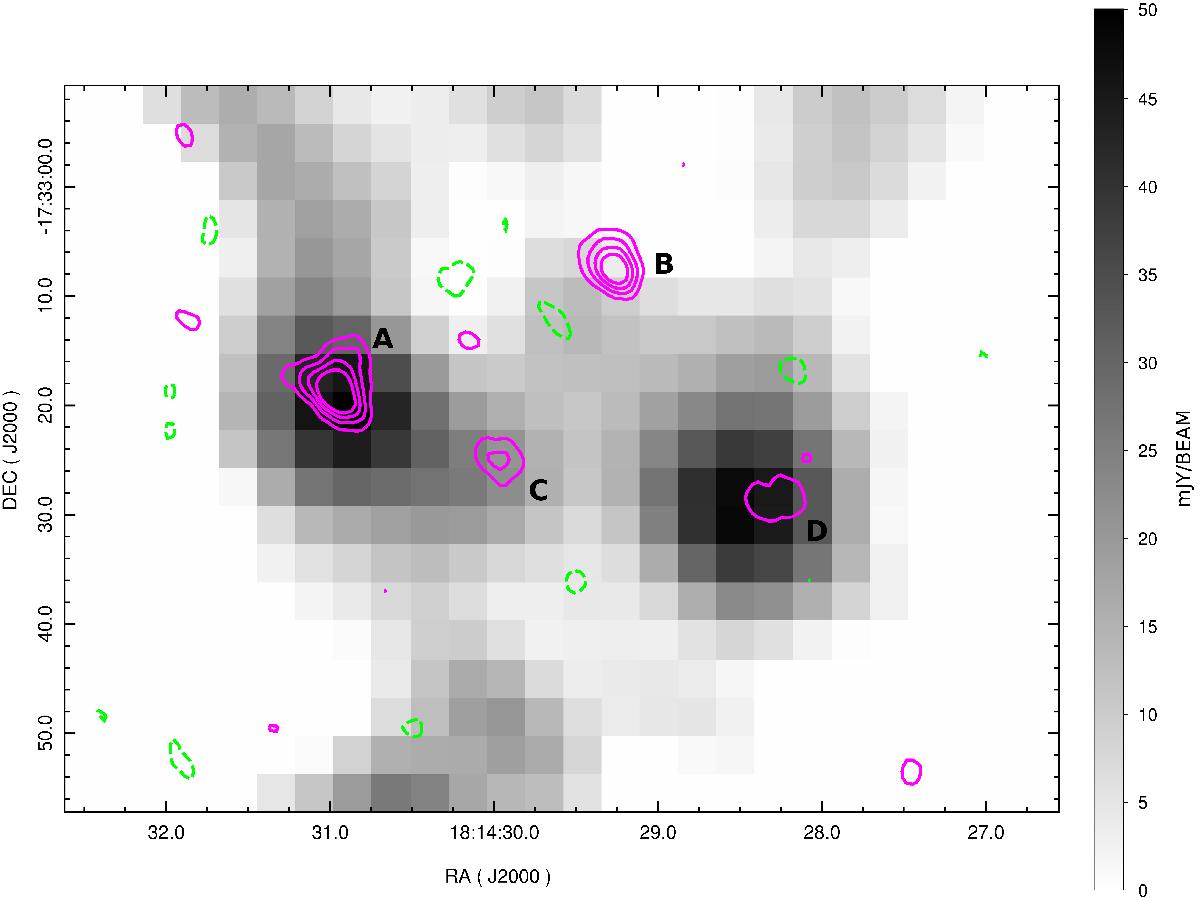
SMA 1.3 mm continuum data overlayed on 1.2 mm MAMBO continuum data (mJy/beam). The contours indicate the SMA continuum at −3, 3, 5,7 and 9 mJy/beam. Positive contours are shown in pink and negative contours are shown dashed in green. Letters A, B, C, D indicate the 4 sub-fragments seen in the region which are identified as peaks in the 1.3 mm SMA continuum. The MAMBO beamsize is 10.7′′.
Current usage metrics show cumulative count of Article Views (full-text article views including HTML views, PDF and ePub downloads, according to the available data) and Abstracts Views on Vision4Press platform.
Data correspond to usage on the plateform after 2015. The current usage metrics is available 48-96 hours after online publication and is updated daily on week days.
Initial download of the metrics may take a while.