Fig. 2
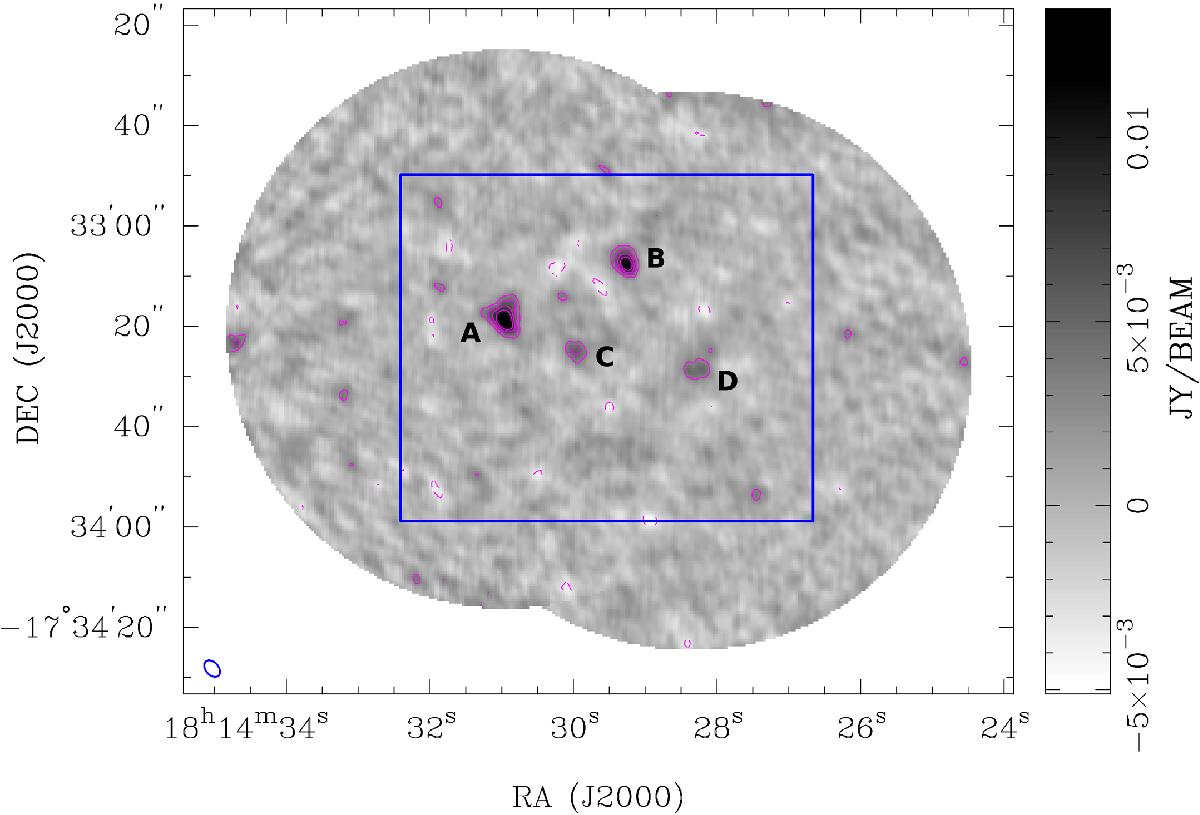
The primary beam corrected linear mosaic of the 1.3 mm continuum data obtained in two SMA pointings towards MM1 and MM2 (Jy/beam). The central portion, outlined in blue, indicates the region shown in Fig. 3. The synthesised beam is shown in the bottom left hand corner of the image. Contours are at − 3σ,3σ,5σ,7σ,9σ where σ ≈ 1 mJy/beam. Positive contours are indicated by the solid lines and negative contours by the dashed lines. Letters A, B, C and D label the 4 largest sub-fragments seen in the data, defined by the 3σ contours.
Current usage metrics show cumulative count of Article Views (full-text article views including HTML views, PDF and ePub downloads, according to the available data) and Abstracts Views on Vision4Press platform.
Data correspond to usage on the plateform after 2015. The current usage metrics is available 48-96 hours after online publication and is updated daily on week days.
Initial download of the metrics may take a while.