Fig. 1
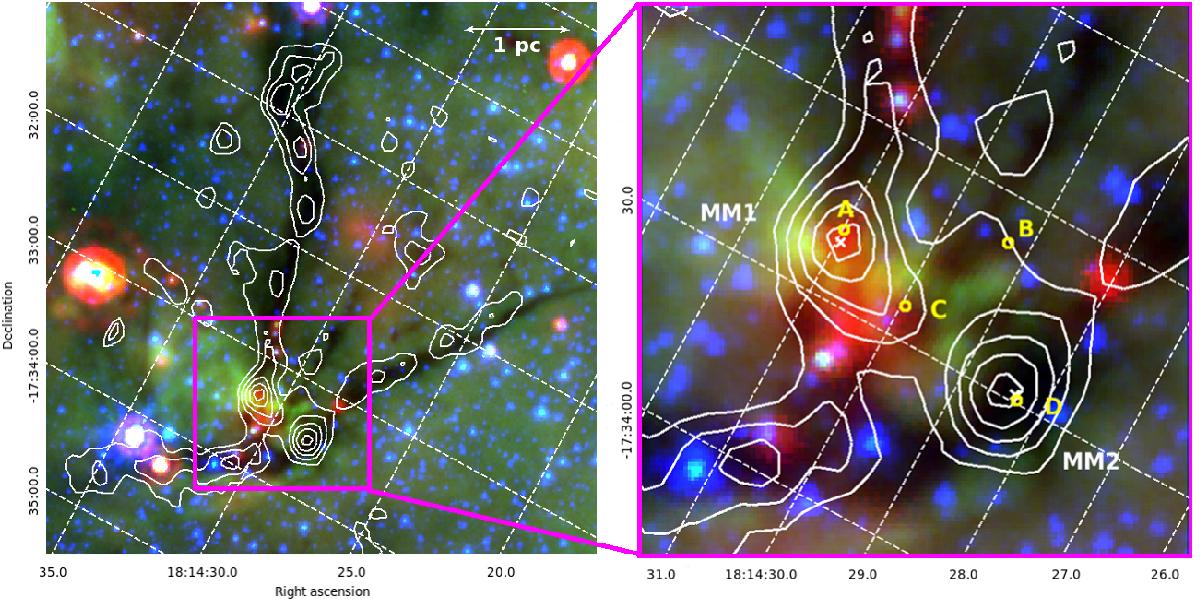
A three-colour Spitzer image of SDC13 (24 μm in red, 8 μm in green and 3.6 μm in blue) overlayed with IRAM MAMBO 1.2 mm continuum contours (white) at 5, 15, 25, 35 and 45 mJy (left). The highlighted region (right) shows the two largest fragments (i.e. cores) in SDC13, MM1 and MM2, whose positions are marked with white crosses. Four sub-fragments are seen in the SMA 1.3 mm continuum observations of the region. The positions of these sub-fragments, A, B, C and D, are marked with yellow circles.
Current usage metrics show cumulative count of Article Views (full-text article views including HTML views, PDF and ePub downloads, according to the available data) and Abstracts Views on Vision4Press platform.
Data correspond to usage on the plateform after 2015. The current usage metrics is available 48-96 hours after online publication and is updated daily on week days.
Initial download of the metrics may take a while.