Fig. 32
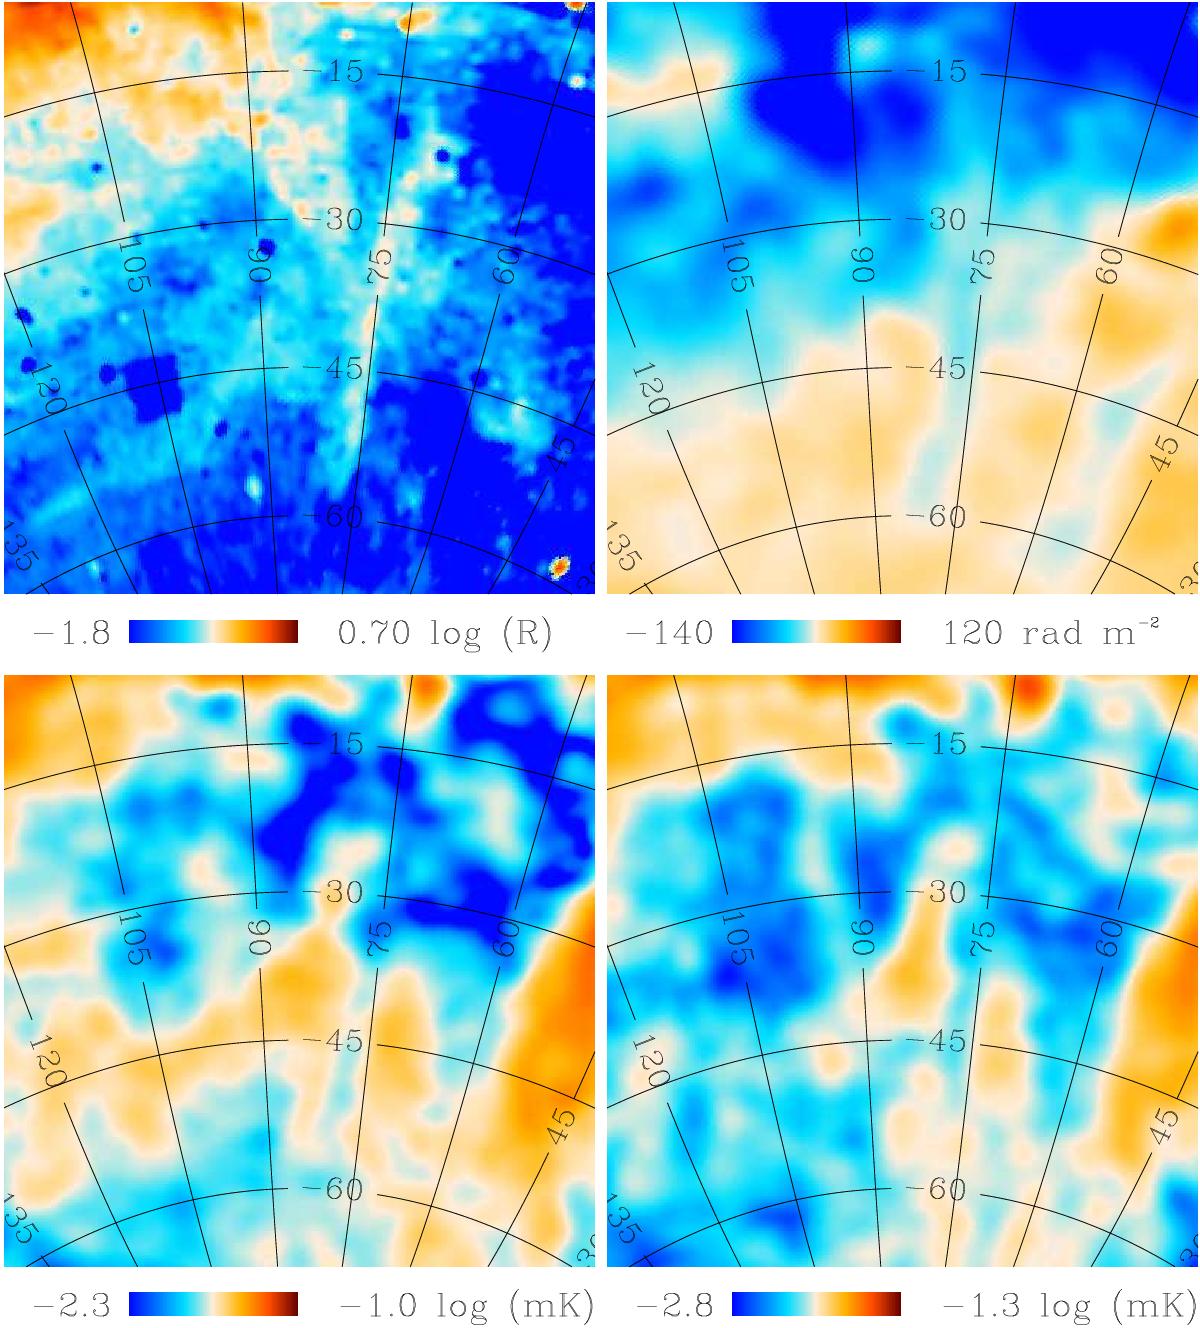
Top left: Hα map in the velocity range −80 <Vlsr< −40 km s-1. Notice the vertical filament that runs at l ≈ 75° and −60°<b< −20°. Top right: Faraday depth map from Oppermann et al. (2012), which also shows a filament at the same location, with a mean value of −25 rad m-2 along its extension. The filament has a counterpart in “absorption,” visible as a trough in polarization intensity maps. Bottom left: WMAP 23 GHz polarization intensity map. Bottom right: Planck-WMAP polarization intensity map. The Hα map on the top left corner has an angular resolution of 1deg, while the other three maps have a common resolution of 3deg. The grid spacing is 15deg.

Current usage metrics show cumulative count of Article Views (full-text article views including HTML views, PDF and ePub downloads, according to the available data) and Abstracts Views on Vision4Press platform.
Data correspond to usage on the plateform after 2015. The current usage metrics is available 48-96 hours after online publication and is updated daily on week days.
Initial download of the metrics may take a while.