Free Access
Fig. 14
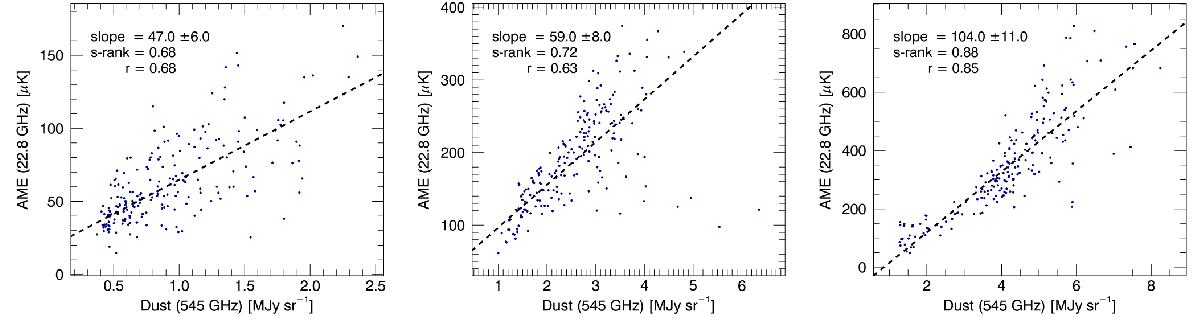
T–T plots comparing the Commander AME map evaluated at 22.8 GHz to the Commander dust map at 545 GHz in three regions, as shown in Fig. 13. The best fit is shown as a dashed line. From left to right, for the Pegasus plume, Musca, and λ Orionis regions.
Current usage metrics show cumulative count of Article Views (full-text article views including HTML views, PDF and ePub downloads, according to the available data) and Abstracts Views on Vision4Press platform.
Data correspond to usage on the plateform after 2015. The current usage metrics is available 48-96 hours after online publication and is updated daily on week days.
Initial download of the metrics may take a while.