Free Access
Fig. 11
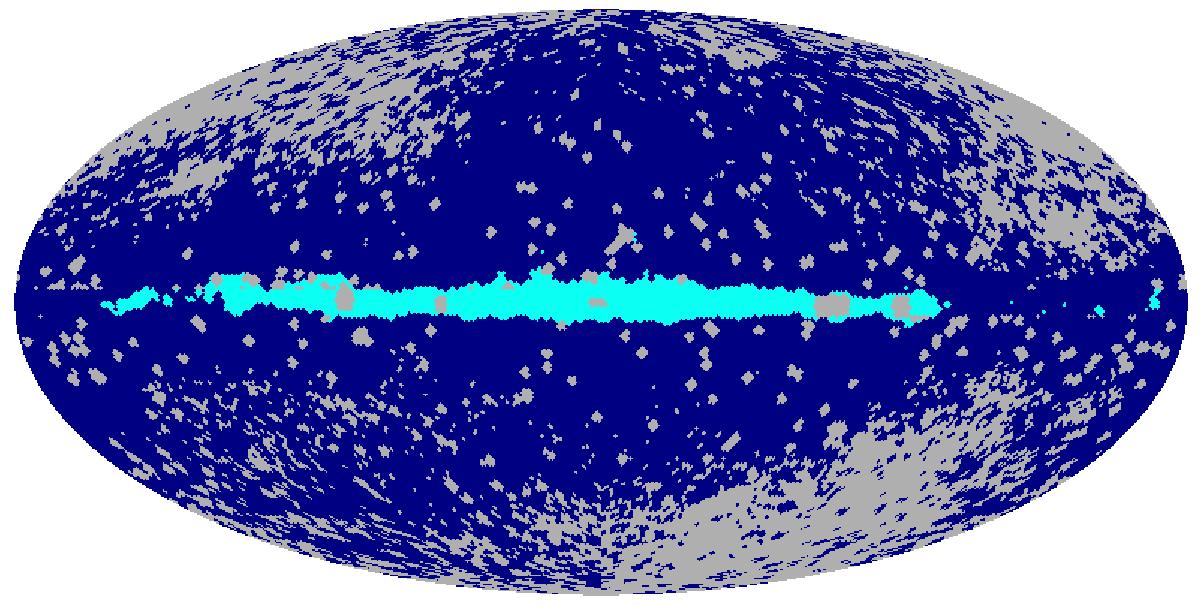
Mask used for the AME T–T plots. The regions in grey are masked in the T–T plots. The region in light blue shows where the AME at 22.8 GHz is brighter than 1 mK; this is also masked when determining the best-fitting emissivity. We also mask the ecliptic plane (| β | < 20deg) when analysing the IRAS and WISE data.
Current usage metrics show cumulative count of Article Views (full-text article views including HTML views, PDF and ePub downloads, according to the available data) and Abstracts Views on Vision4Press platform.
Data correspond to usage on the plateform after 2015. The current usage metrics is available 48-96 hours after online publication and is updated daily on week days.
Initial download of the metrics may take a while.