Fig. 8
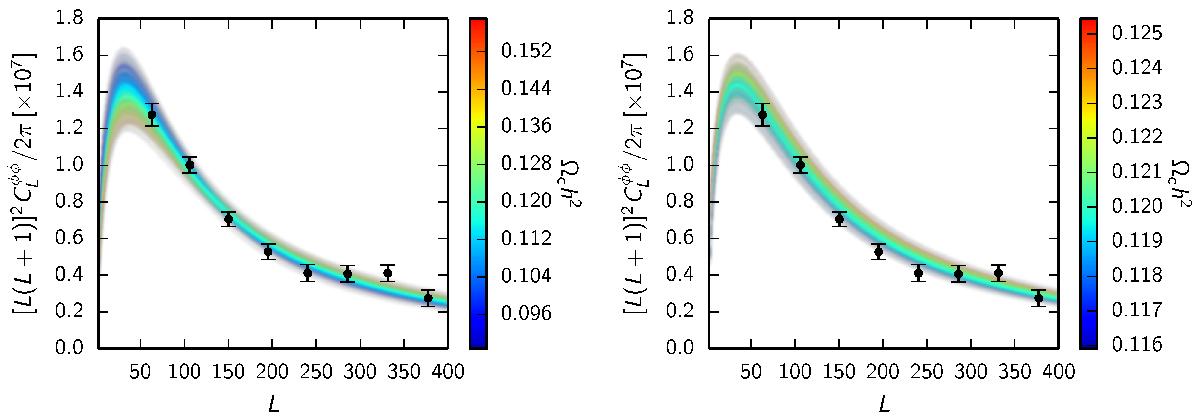
Lensing potential power spectra in the base ΛCDM model drawn from the posterior of the lensing-only likelihood (left) and the Planck TT+lowP likelihood (right), coloured by the value of the dark matter density Ωch2. For fixed CMB power spectra (i.e. the right-hand plot) the lensing power spectrum shape is nearly fixed, but the amplitude increases as the matter density increases across the acoustic-scale degeneracy (the accompanying reduction in As is sub-dominant). With lensing reconstruction data, as Ωch2 varies the lensing spectrum changes shape, with the amplitude around the best-measured L ≈ 150, remaining pinned by the accuracy of the measurement there. A combination of the lensing and Planck TT+lowP data measures the matter density significantly better, with the higher values in the right-hand plot being excluded. Note that the colour scales on the plots are different.
Current usage metrics show cumulative count of Article Views (full-text article views including HTML views, PDF and ePub downloads, according to the available data) and Abstracts Views on Vision4Press platform.
Data correspond to usage on the plateform after 2015. The current usage metrics is available 48-96 hours after online publication and is updated daily on week days.
Initial download of the metrics may take a while.