Fig. 15
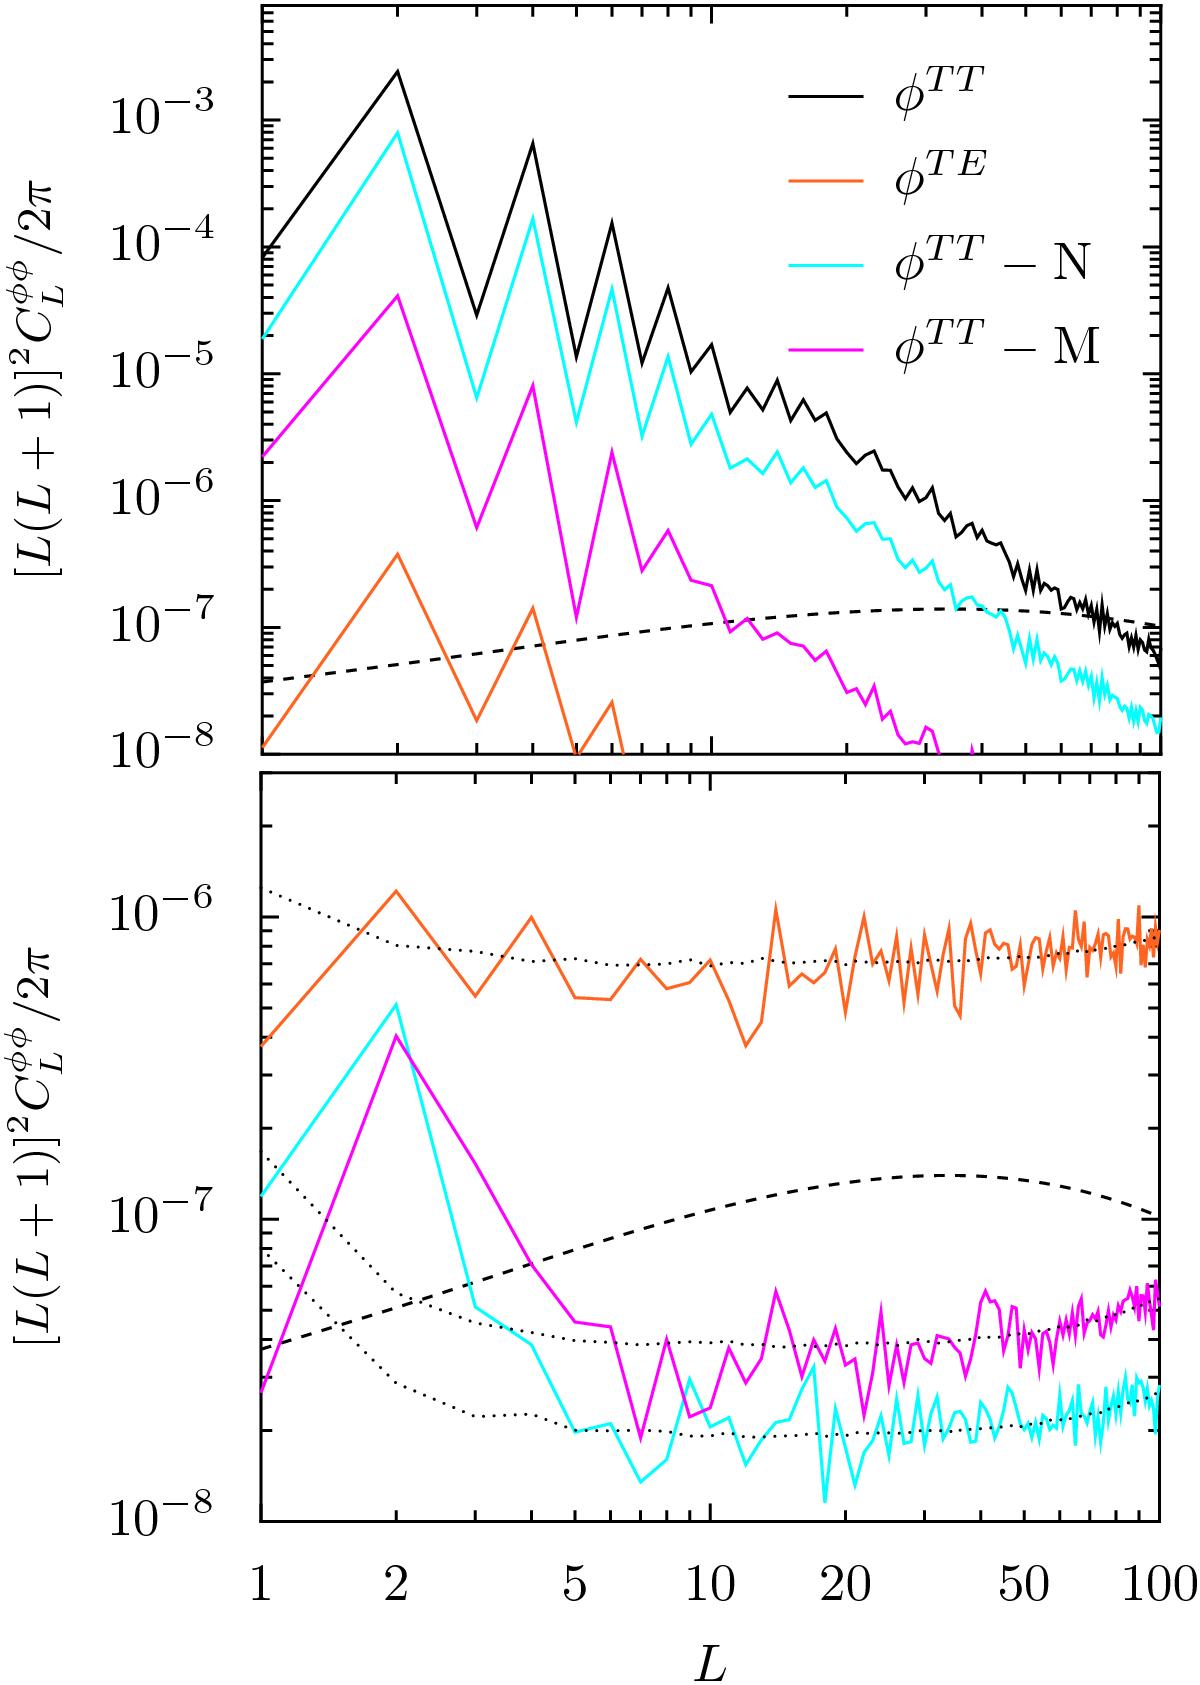
Upper: power spectrum of the low-L mean-field (measured from Monte Carlo simulations) for the TT lensing estimator as well as several bias-hardened estimators. The mean-field power spectrum of the TE lensing estimator is plotted for comparison, and the fiducial lensing potential power spectrum is shown in dashed black. To avoid visual clutter we have not shown the source-hardened estimator TT−S; its spectrum is midway between the noise-hardened (TT−N) and mask-hardened (TT−M) cases. Lower: power spectra of the differences between the TT lensing estimate and the bias-hardened reconstructions or the TE reconstruction (with the same colour scheme as in the top panel). The expected power spectra of the differences, estimated from simulations, are plotted as black dotted lines.
Current usage metrics show cumulative count of Article Views (full-text article views including HTML views, PDF and ePub downloads, according to the available data) and Abstracts Views on Vision4Press platform.
Data correspond to usage on the plateform after 2015. The current usage metrics is available 48-96 hours after online publication and is updated daily on week days.
Initial download of the metrics may take a while.