Fig. 12
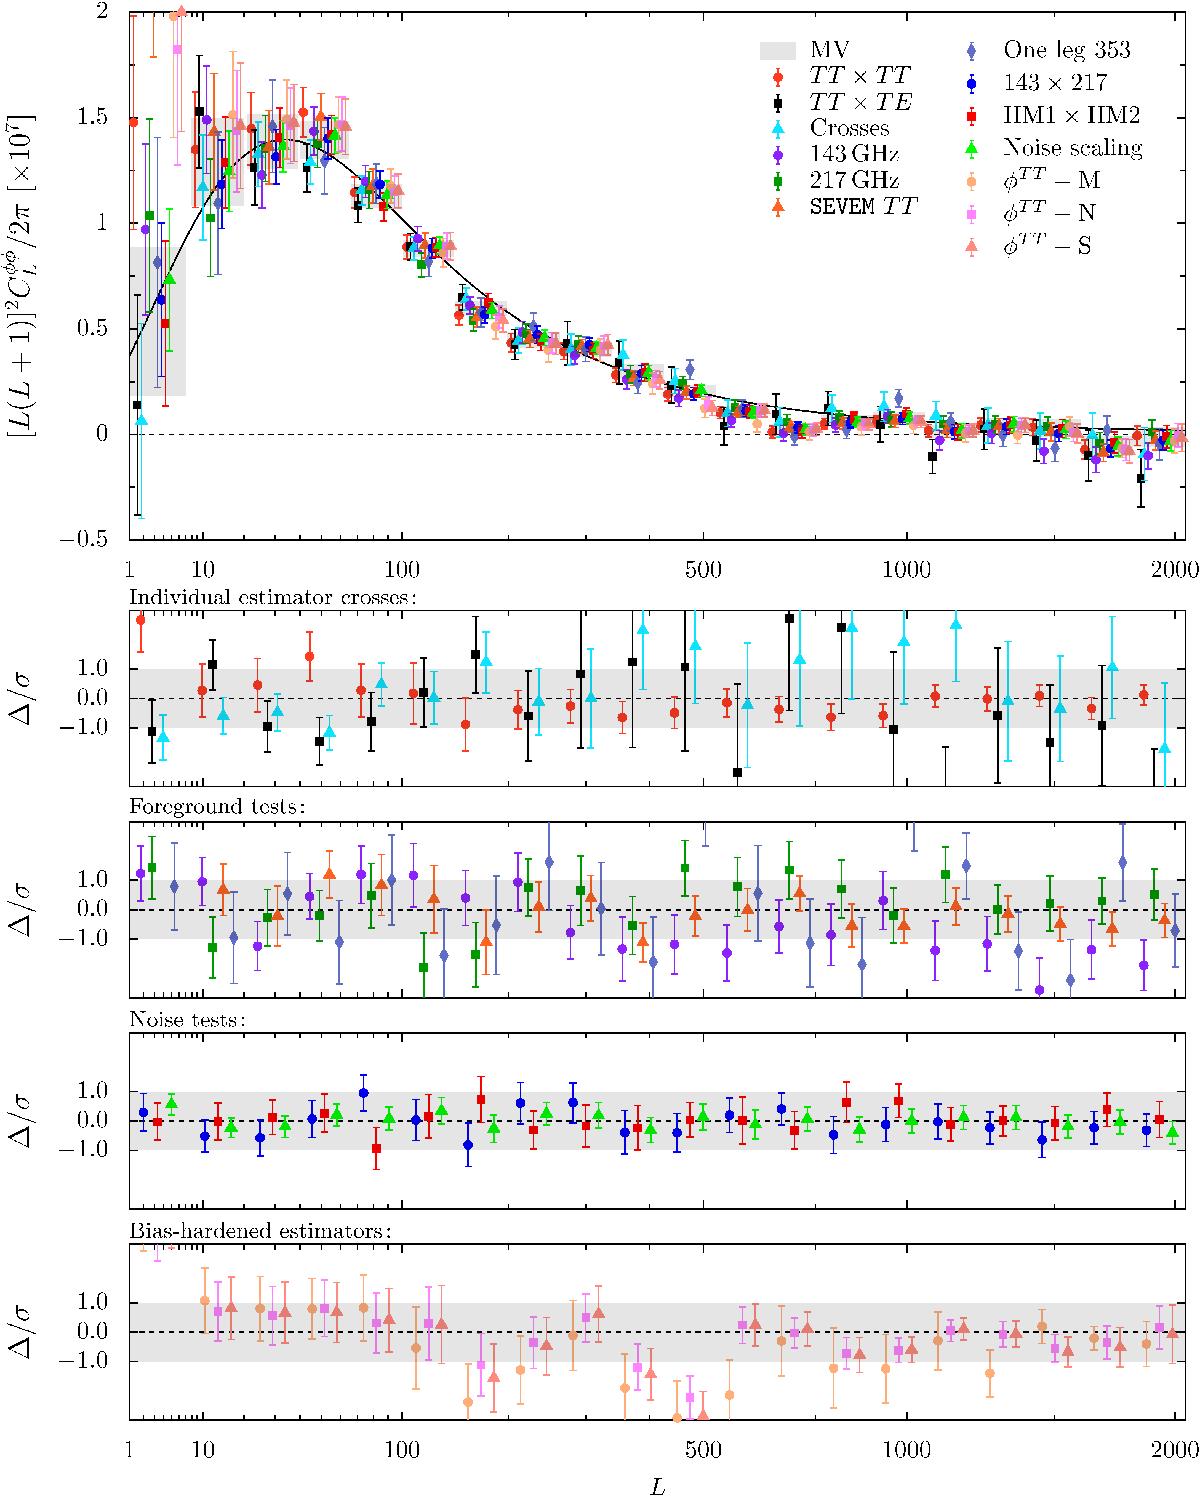
Summary of lensing power spectrum consistency tests. Upper panel: comparison of the lensing power spectra for the baseline MV reconstruction and several alternative estimators with different data/analysis choices discussed in the text. Lower panels: detailed plots of the difference between each alternative reconstruction and the MV power spectrum, in units of the MV error bars (σ). The ± 1σ band is indicated in grey. Error bars on individual data points give the standard deviation of the expected difference from the MV reconstruction for each case, estimated using Monte Carlo simulations.
Current usage metrics show cumulative count of Article Views (full-text article views including HTML views, PDF and ePub downloads, according to the available data) and Abstracts Views on Vision4Press platform.
Data correspond to usage on the plateform after 2015. The current usage metrics is available 48-96 hours after online publication and is updated daily on week days.
Initial download of the metrics may take a while.