Free Access
Fig. 1
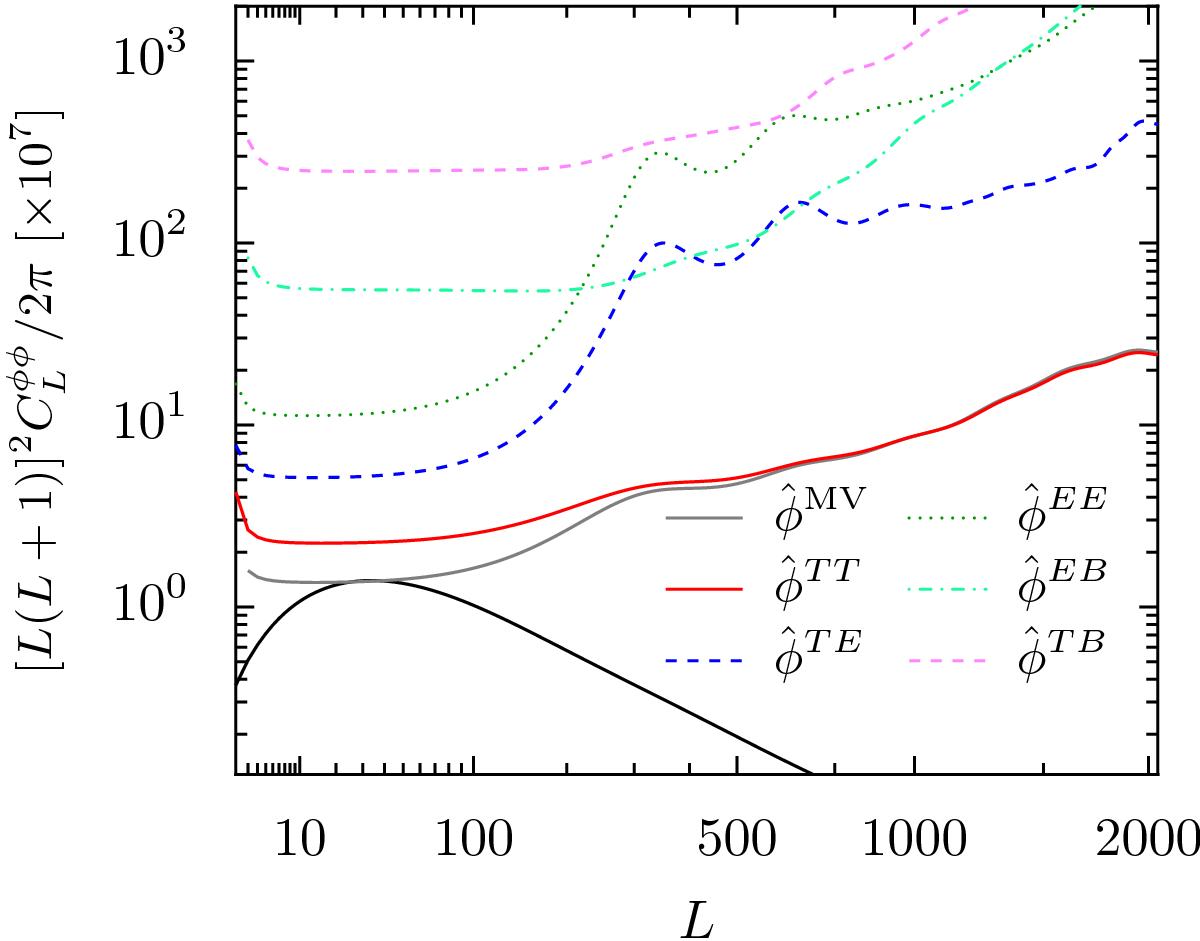
Lens reconstruction noise levels ![]() for the TT, TE, EE, EB, and TB estimators applied to the SMICA full-mission CMB map. The noise level for their minimum-variance combination (MV) is also shown. The fiducial ΛCDM theory power spectrum
for the TT, TE, EE, EB, and TB estimators applied to the SMICA full-mission CMB map. The noise level for their minimum-variance combination (MV) is also shown. The fiducial ΛCDM theory power spectrum ![]() used in our Monte Carlo simulations is plotted as the black solid line.
used in our Monte Carlo simulations is plotted as the black solid line.
Current usage metrics show cumulative count of Article Views (full-text article views including HTML views, PDF and ePub downloads, according to the available data) and Abstracts Views on Vision4Press platform.
Data correspond to usage on the plateform after 2015. The current usage metrics is available 48-96 hours after online publication and is updated daily on week days.
Initial download of the metrics may take a while.