Fig. 7
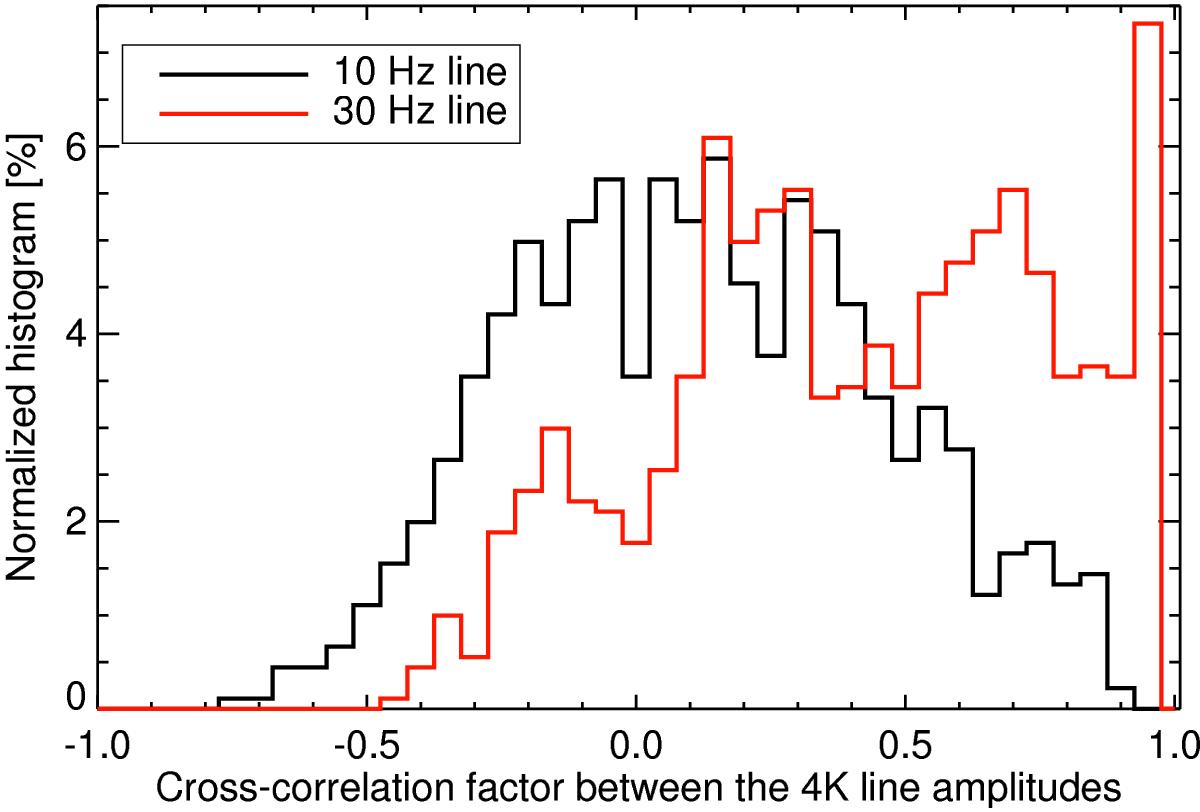
Normalized histograms of the correlation coefficients of the 10 and 30 Hz 4-K line amplitudes. The amplitude is computed per ring and per bolometer from the two coefficients (sine and cosine) of a given line. For each pair of distinct bolometers (from 100 to 353 GHz), a correlation coefficient is computed between the two amplitudes during the mission. The black normalized histogram shows the 10 Hz line correlation coefficients of the 903 (= 43 × 42 / 2) pairs. The red curve shows the 30 Hz line histogram. The 30 Hz line is clearly correlated between different bolometers. This is the only line that shows a significant correlation.
Current usage metrics show cumulative count of Article Views (full-text article views including HTML views, PDF and ePub downloads, according to the available data) and Abstracts Views on Vision4Press platform.
Data correspond to usage on the plateform after 2015. The current usage metrics is available 48-96 hours after online publication and is updated daily on week days.
Initial download of the metrics may take a while.