Free Access
Fig. 6
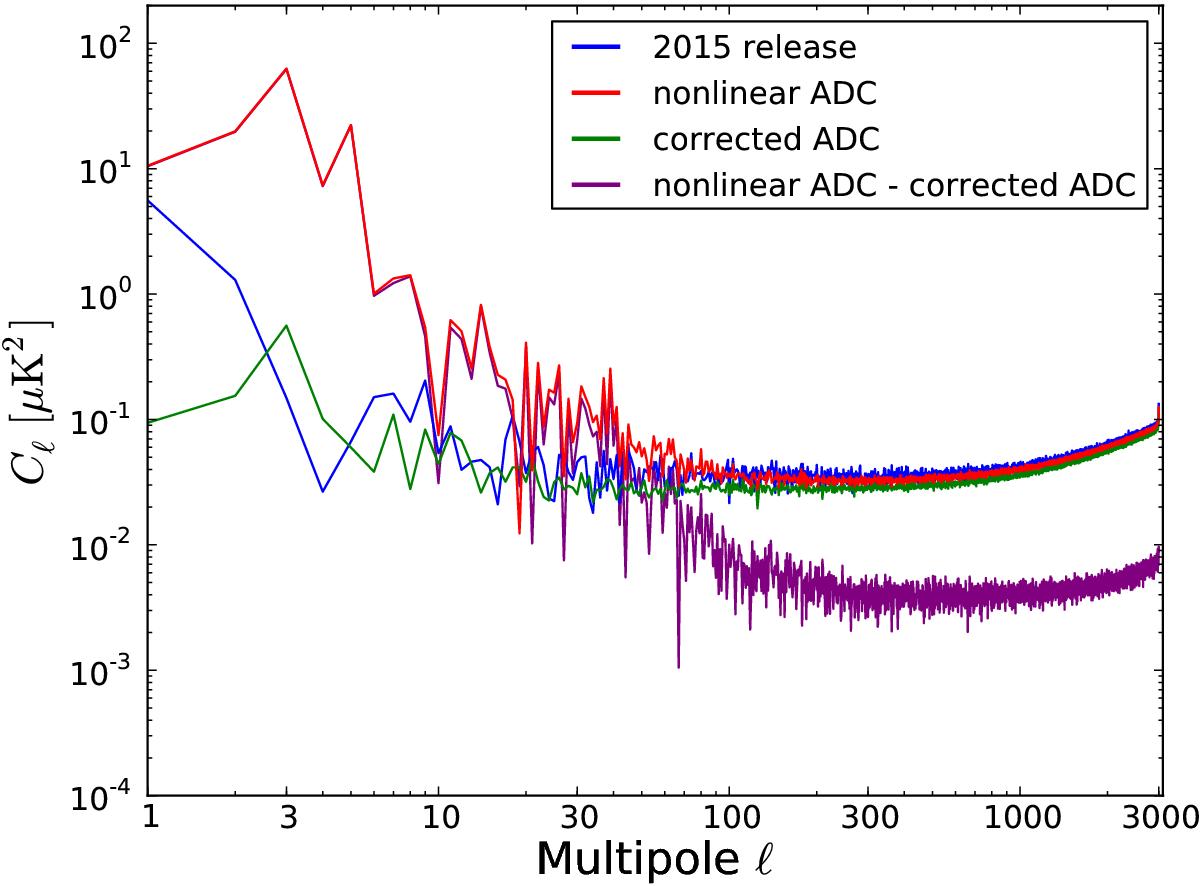
Survey-difference angular power spectra for the 100-4b bolometer. The 2015 release data (blue curve) are compared with simulated data containing ADC nonlinearities. Green and red curves show simulations produced, with and without the ADC correction, respectively.
Current usage metrics show cumulative count of Article Views (full-text article views including HTML views, PDF and ePub downloads, according to the available data) and Abstracts Views on Vision4Press platform.
Data correspond to usage on the plateform after 2015. The current usage metrics is available 48-96 hours after online publication and is updated daily on week days.
Initial download of the metrics may take a while.