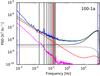
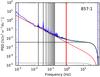
Fig. 26
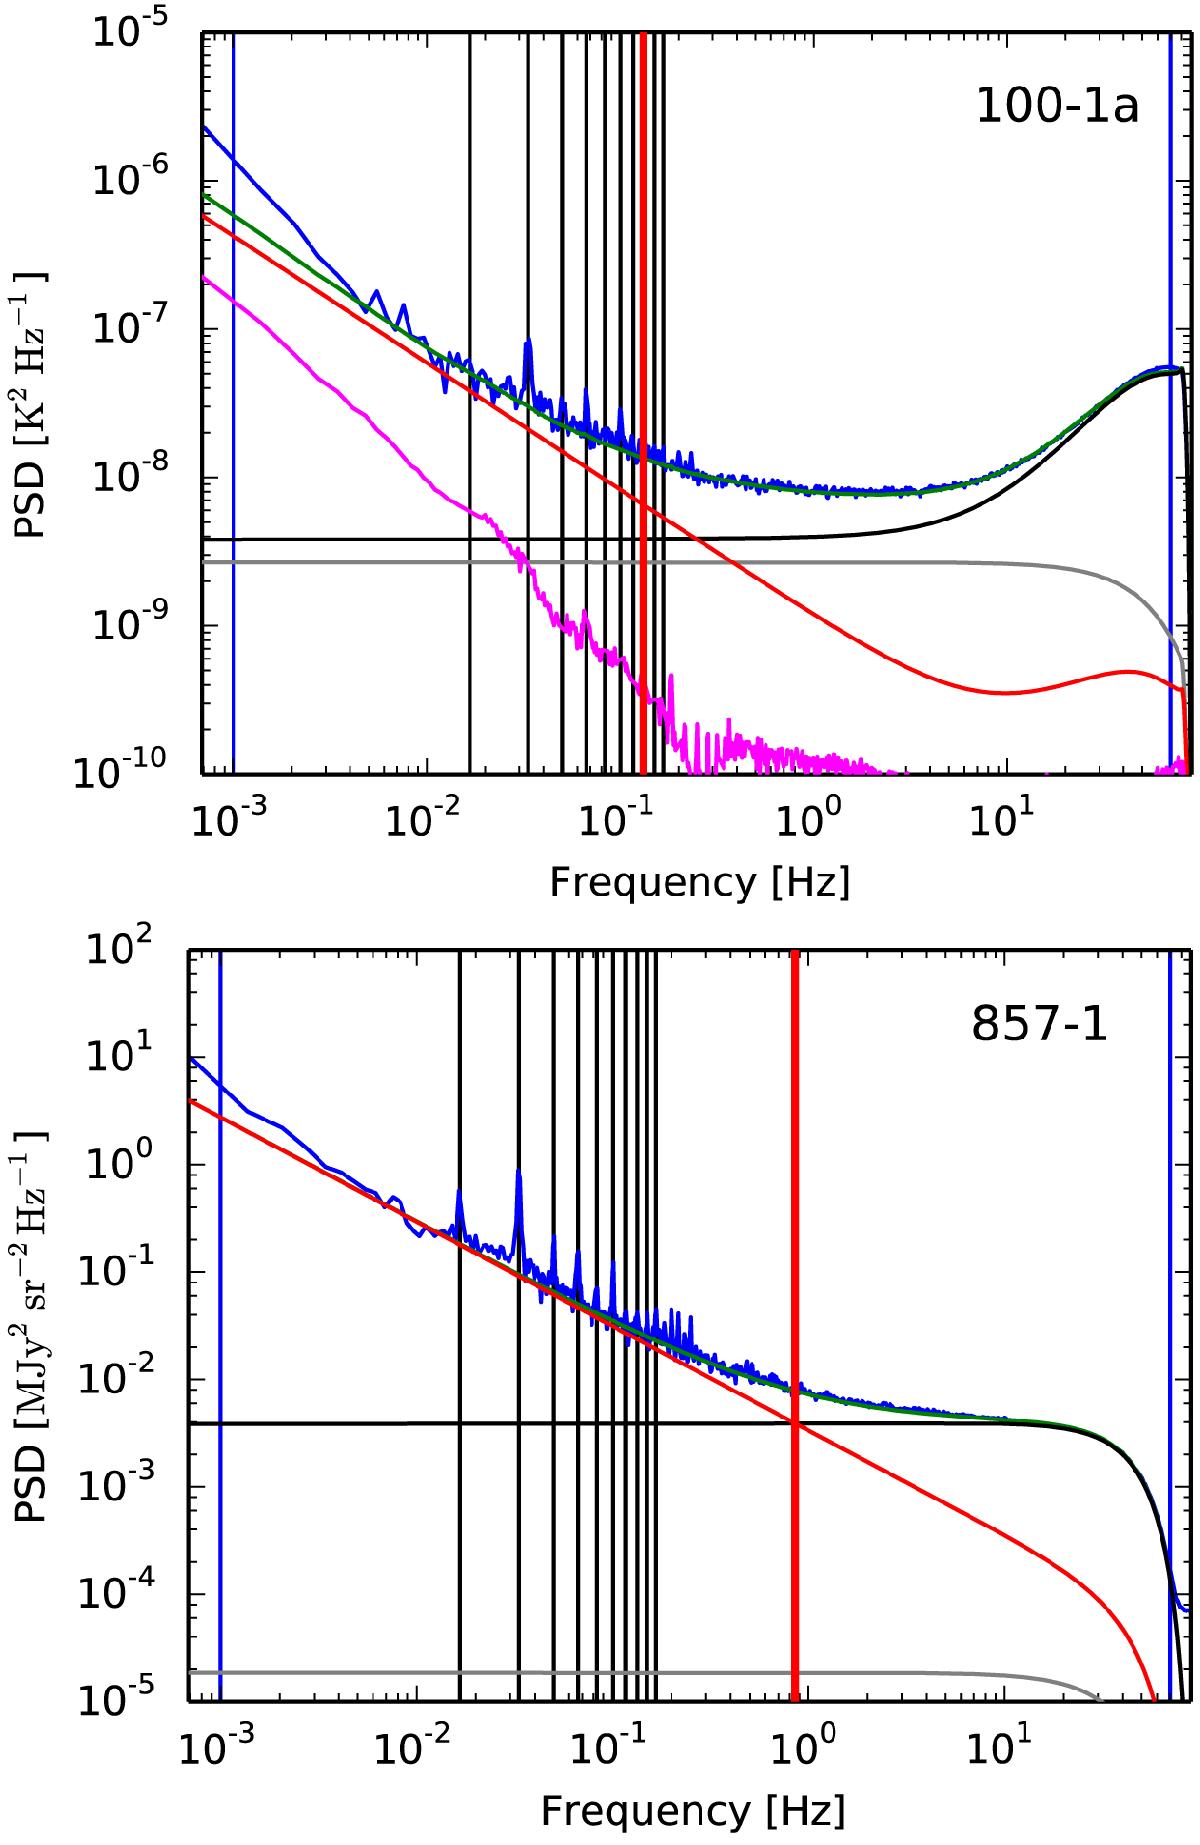
Two examples of the 4-component noise model fits to measured noise PSDs. The underlying noise estimation for these fits is described in Planck Collaboration XII (2016). It measures the sample auto-covariance of signal-subtracted and masked data to overcome effects of gaps and signal residuals. The blue curve is the measured PSD averaged over 30 pointing periods. The red curve is the 1 /f component, deconvolved with the bolometer transfer function. The black curve is the electronic white noise component and the grey curve is the photonic white noise component. The magenta curve is the measured a/b correlated component. The green curve is the sum of all noise model components. Vertical blue lines indicate the region where the fit was made and the vertical black lines indicate the 10 lowest spin harmonic frequencies.
Current usage metrics show cumulative count of Article Views (full-text article views including HTML views, PDF and ePub downloads, according to the available data) and Abstracts Views on Vision4Press platform.
Data correspond to usage on the plateform after 2015. The current usage metrics is available 48-96 hours after online publication and is updated daily on week days.
Initial download of the metrics may take a while.