Fig. 25
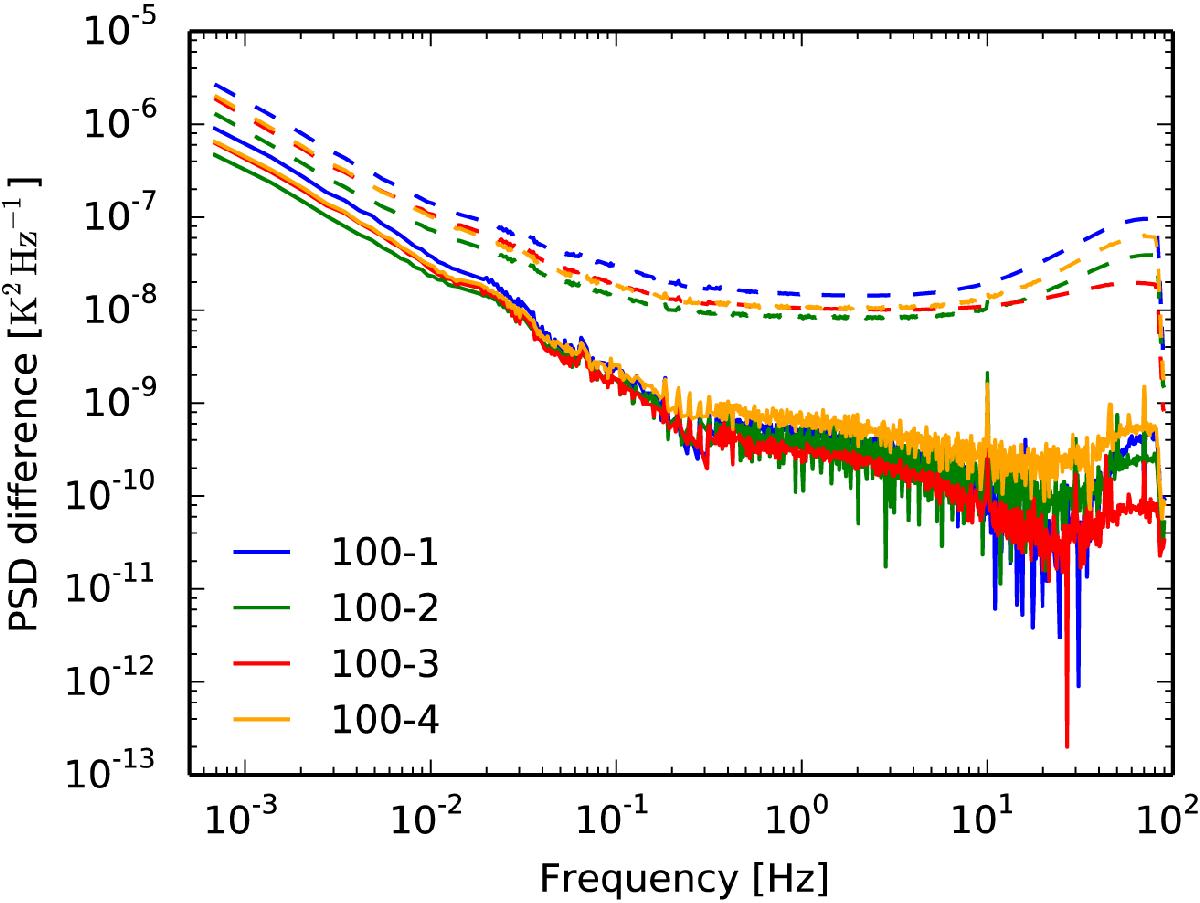
Example of measured summed, (a + b), time stream noise power spectral densities (PSDs; dashed lines) and the difference in the PSD between (a + b) and (a − b) (solid lines). These spectra are bin-by-bin median values across the entire mission and were derived by first measuring the sample autocovariance as described in Planck Collaboration XII (2016).
Current usage metrics show cumulative count of Article Views (full-text article views including HTML views, PDF and ePub downloads, according to the available data) and Abstracts Views on Vision4Press platform.
Data correspond to usage on the plateform after 2015. The current usage metrics is available 48-96 hours after online publication and is updated daily on week days.
Initial download of the metrics may take a while.