Fig. 24
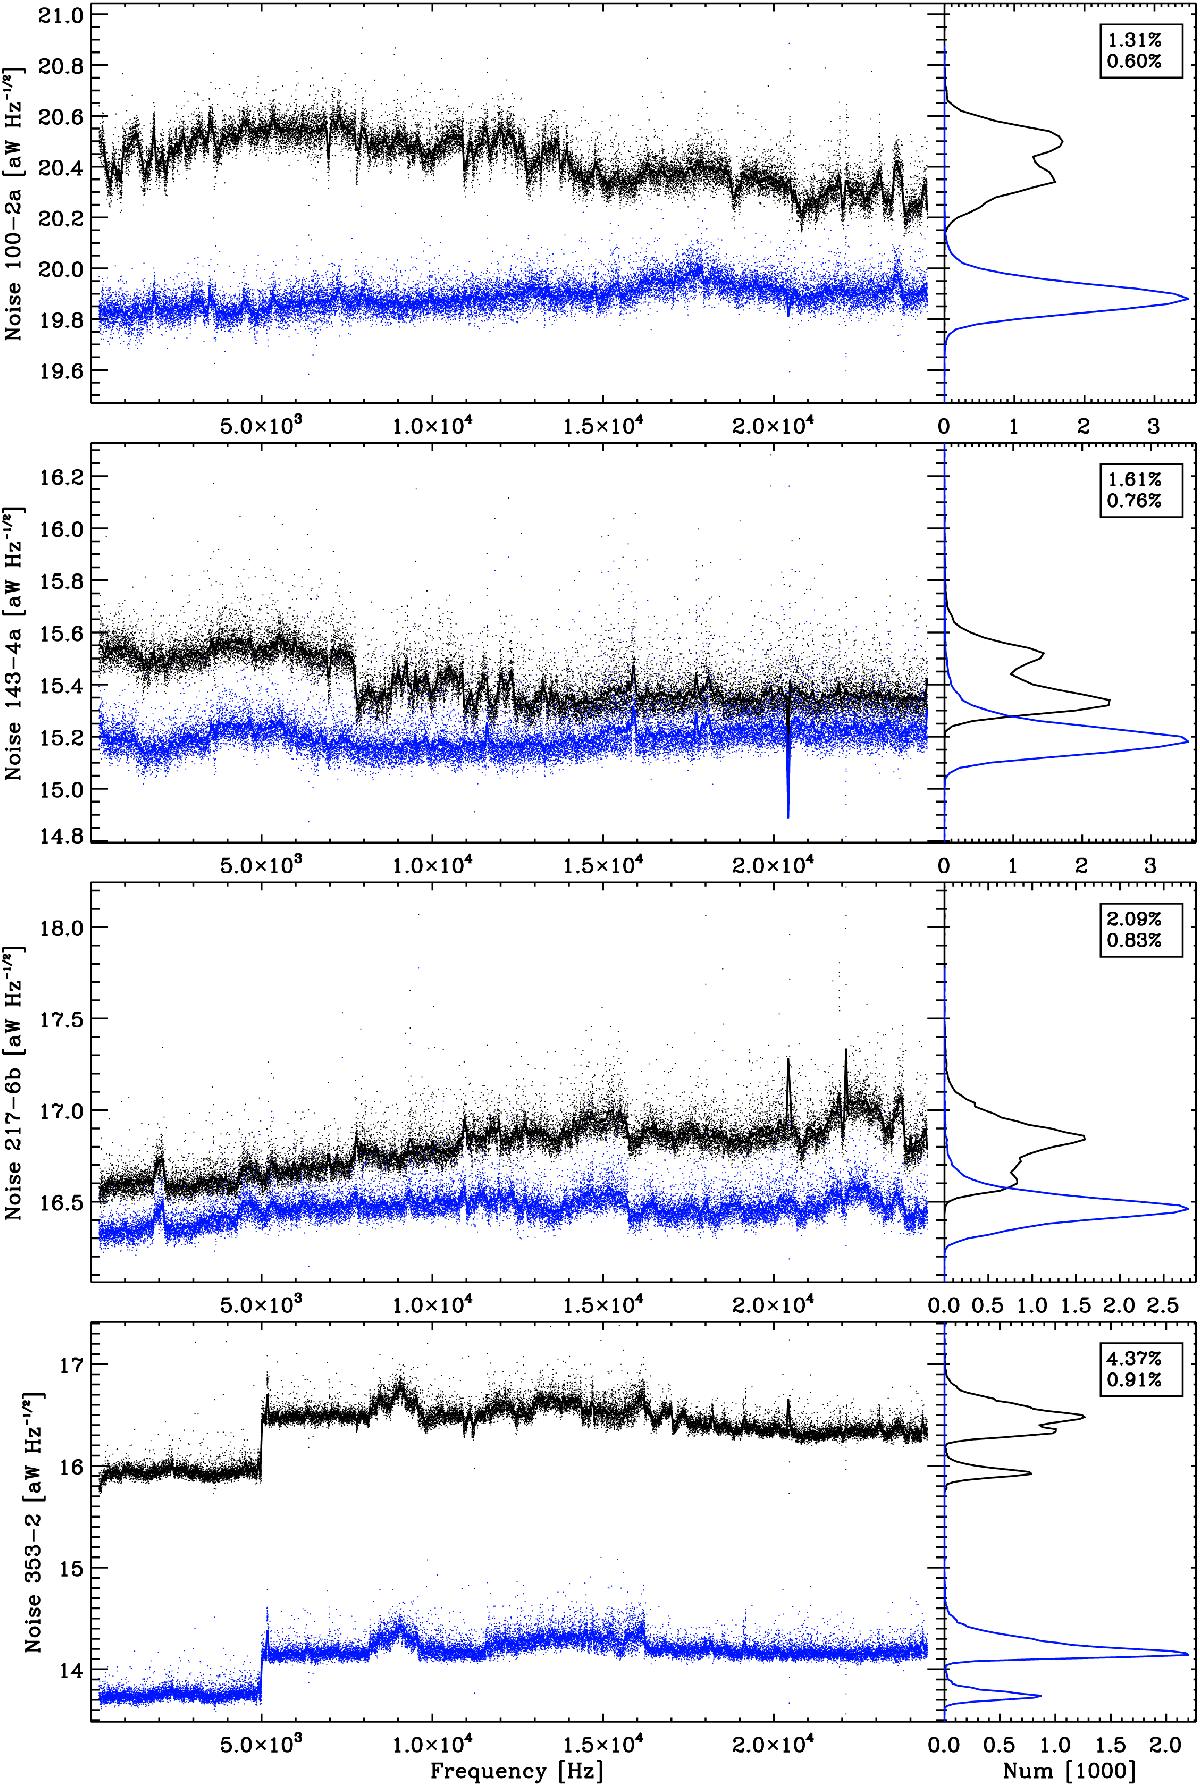
Noise stationarity for a selection of four bolometers. The left panels show the total noise for each bolometer (dots) as a function of ring number. The total noise is the white noise spectral density giving the same rms per sample as the measured one. The solid line shows a running box average. The black dots are from the 2013 data release and the blue dots from this release. The right panels show histograms of the left trends. The box gives the width of the distribution at half maximum, as measured on the histogram, normalized to the mean noise level. The time response deconvolution has changed between the two data releases, so the absolute noise level is different.
Current usage metrics show cumulative count of Article Views (full-text article views including HTML views, PDF and ePub downloads, according to the available data) and Abstracts Views on Vision4Press platform.
Data correspond to usage on the plateform after 2015. The current usage metrics is available 48-96 hours after online publication and is updated daily on week days.
Initial download of the metrics may take a while.