Free Access
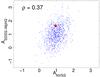
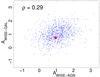
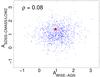
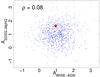
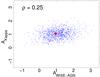
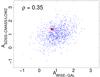
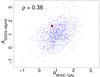
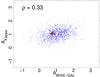
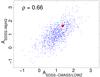
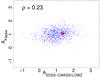
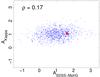
Fig. 8
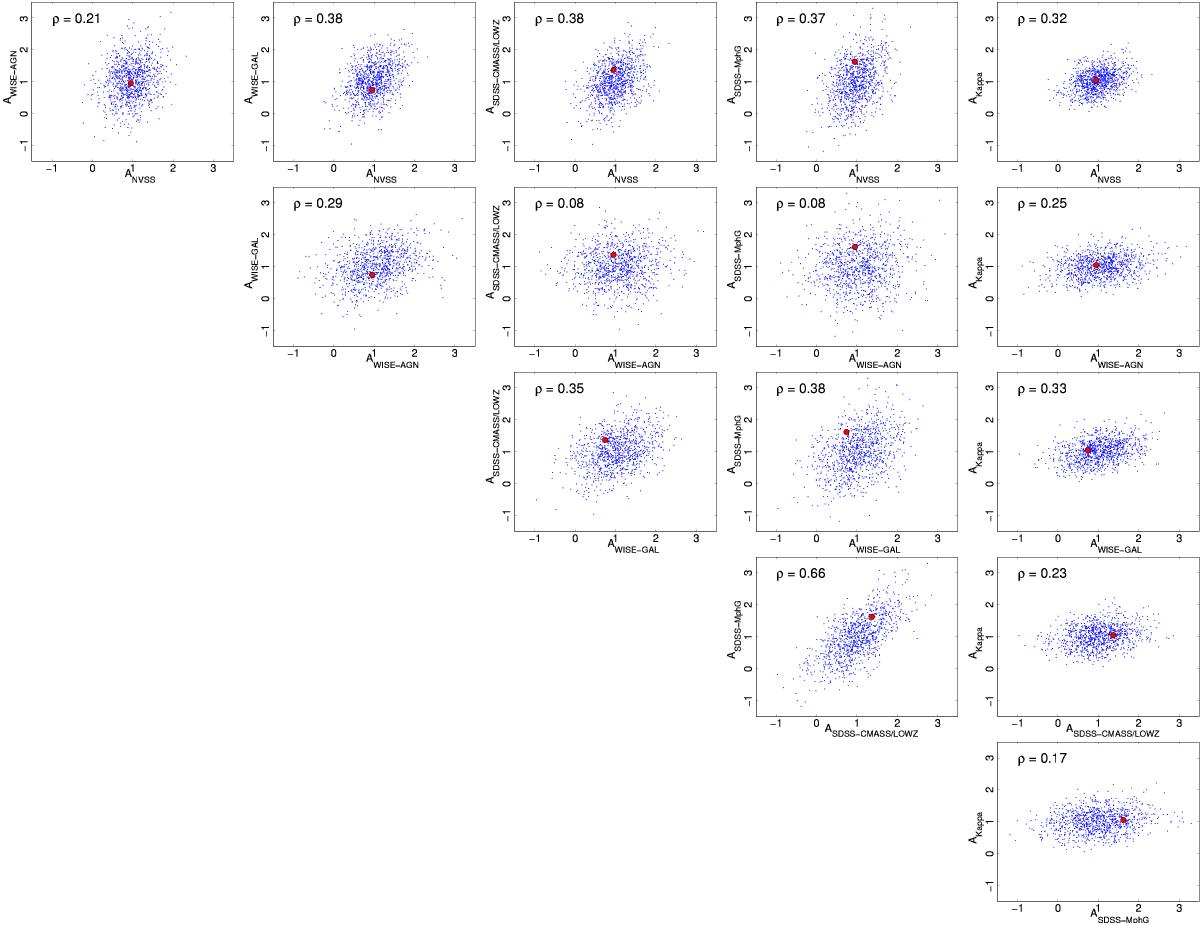
Correlation among the estimated AISW amplitudes for the different surveys. The small blue dots are the amplitudes estimated from the simulations described in Sect. 2.3, whereas the large red dot stands for the amplitudes estimated from the data. For each pair, the correlation coefficient is indicated.
This figure is made of several images, please see below:

Current usage metrics show cumulative count of Article Views (full-text article views including HTML views, PDF and ePub downloads, according to the available data) and Abstracts Views on Vision4Press platform.
Data correspond to usage on the plateform after 2015. The current usage metrics is available 48-96 hours after online publication and is updated daily on week days.
Initial download of the metrics may take a while.