Fig. 20
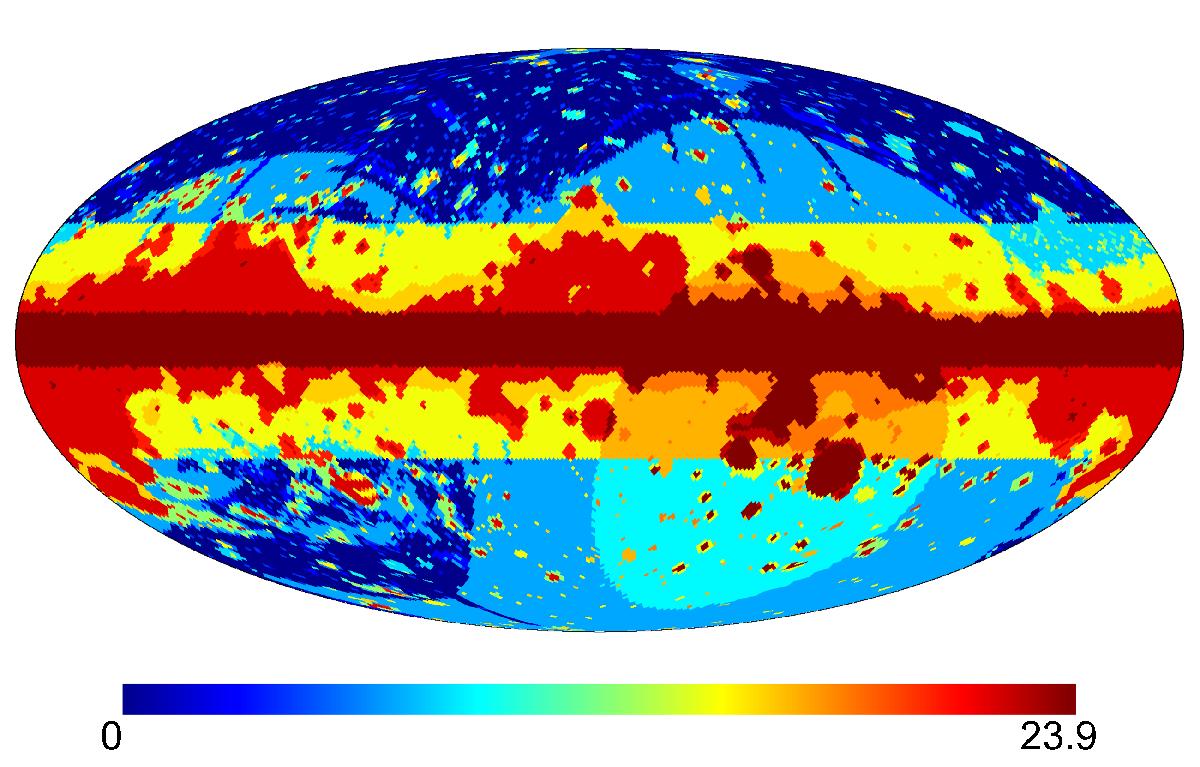
Regions defined by the different intersections of the masks considered for the recovery of the ISW signal, using the LCB filter. To produce this figure, for each mask we construct a map with a constant value given by ![]() in the excluded pixels and zero otherwise. These maps are then added together, producing the pattern seen in the figure. In particular, we choose km = { 2,4,8,16,32,64 } corresponding to the masks used for Kappa, NVSS, SDSS-CMASS/LOWZ, SDSS-MphG, CMB, and WISE, respectively (the square root function is introduced to allow for a better visualization).
in the excluded pixels and zero otherwise. These maps are then added together, producing the pattern seen in the figure. In particular, we choose km = { 2,4,8,16,32,64 } corresponding to the masks used for Kappa, NVSS, SDSS-CMASS/LOWZ, SDSS-MphG, CMB, and WISE, respectively (the square root function is introduced to allow for a better visualization).
Current usage metrics show cumulative count of Article Views (full-text article views including HTML views, PDF and ePub downloads, according to the available data) and Abstracts Views on Vision4Press platform.
Data correspond to usage on the plateform after 2015. The current usage metrics is available 48-96 hours after online publication and is updated daily on week days.
Initial download of the metrics may take a while.