Fig. 2
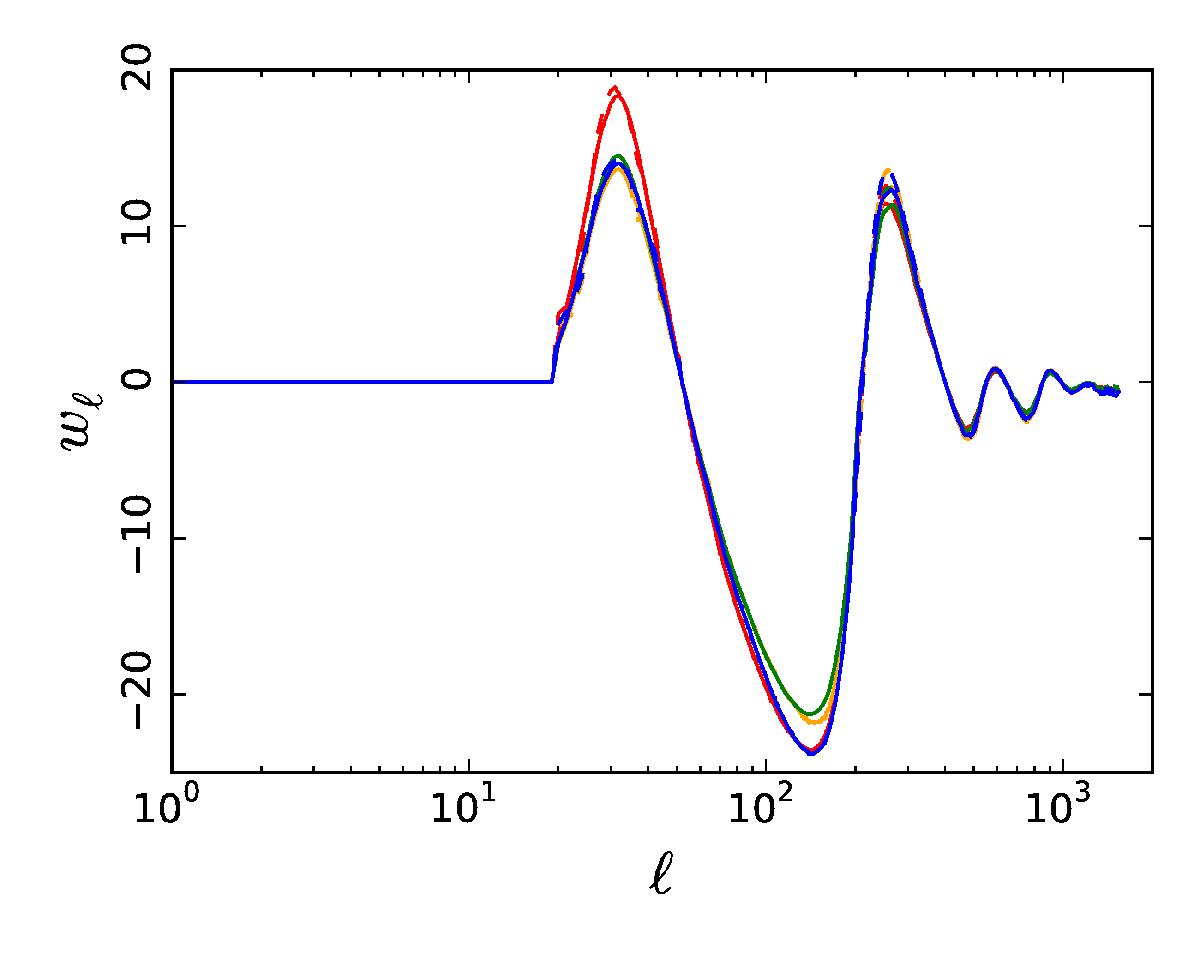
Filter used to construct the TE−c correlated maps for all component separation methods: COMMANDER in red; NILC in orange; SEVEM in green; and SMICA in blue. The solid lines are obtained directly from the data, whereas the dashed ones represent the theoretical shape of the filters, only considering the instrumental noise characteristics of the data and the fiducial Planck angular power spectra.
Current usage metrics show cumulative count of Article Views (full-text article views including HTML views, PDF and ePub downloads, according to the available data) and Abstracts Views on Vision4Press platform.
Data correspond to usage on the plateform after 2015. The current usage metrics is available 48-96 hours after online publication and is updated daily on week days.
Initial download of the metrics may take a while.