Fig. 16
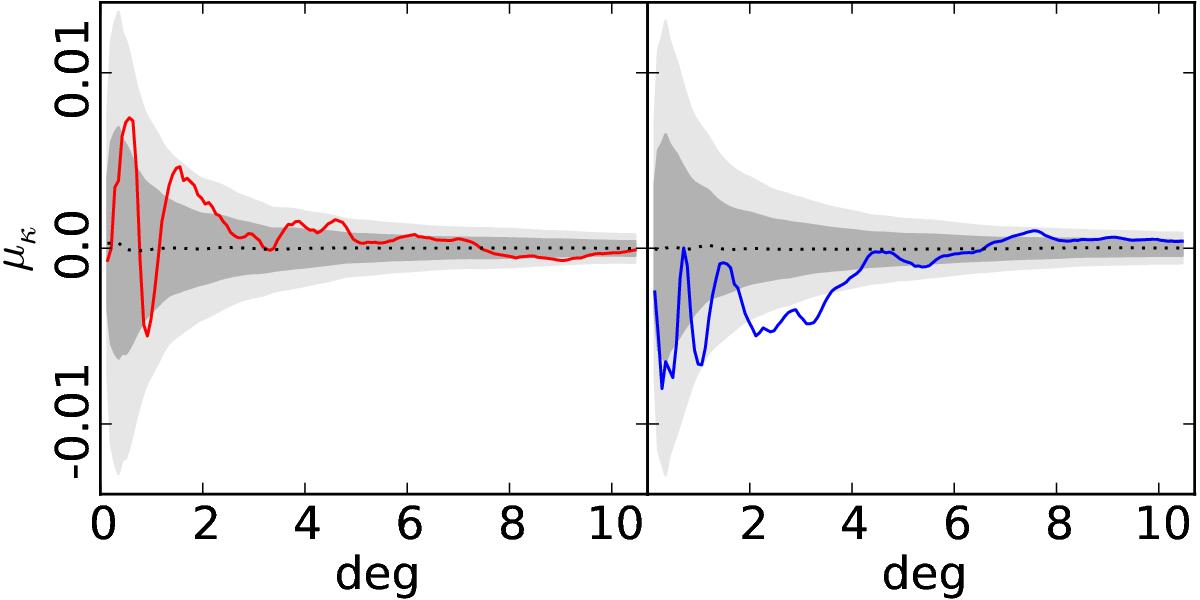
Mean photometry profile of the stacked images from the Planck convergence lensing map, at the locations of the 50 supercluster (left panel) and the 50 supervoid (right panel) from the GR08 catalogue. The dotted black line represents the null hypothesis computed as the mean value of the photometry profiles at the corresponding GR08 positions in 1000 simulations according to the lensing model. The shaded regions show the ± 1σ and ± 2σ uncertainties of these profiles, computed as the dispersion of the mean photometry profiles of the simulations.
Current usage metrics show cumulative count of Article Views (full-text article views including HTML views, PDF and ePub downloads, according to the available data) and Abstracts Views on Vision4Press platform.
Data correspond to usage on the plateform after 2015. The current usage metrics is available 48-96 hours after online publication and is updated daily on week days.
Initial download of the metrics may take a while.