Fig. 14
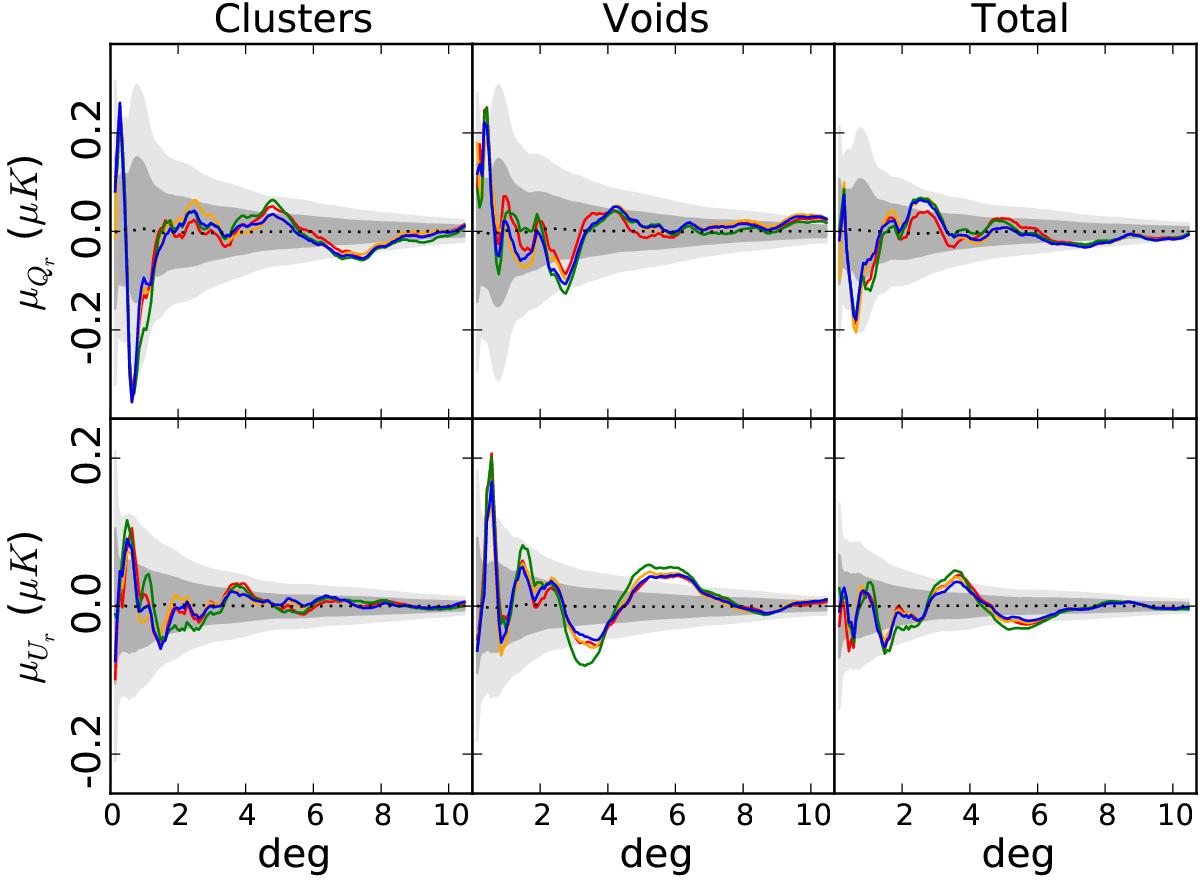
Mean photometry profiles of the Qr (first row) and Ur (second row) components stacked at the 50 supercluster (first column) and 50 supervoid (second column) positions of GR08. The CMB maps used come from COMMANDER (red); NILC (orange); SEVEM (green); and SMICA (blue). The third column shows the difference between the supercluster and the supervoid profiles. The dotted black lines show the mean value of our estimator computed with 1000 FFP8 simulations processed through the SEVEM pipeline at the same locations as the real superstructures. Shaded regions show the ± 1σ and ± 2σ uncertainties of these null profiles; those computed for the rest of component separation methods reach a similar level.
Current usage metrics show cumulative count of Article Views (full-text article views including HTML views, PDF and ePub downloads, according to the available data) and Abstracts Views on Vision4Press platform.
Data correspond to usage on the plateform after 2015. The current usage metrics is available 48-96 hours after online publication and is updated daily on week days.
Initial download of the metrics may take a while.