Fig. 13
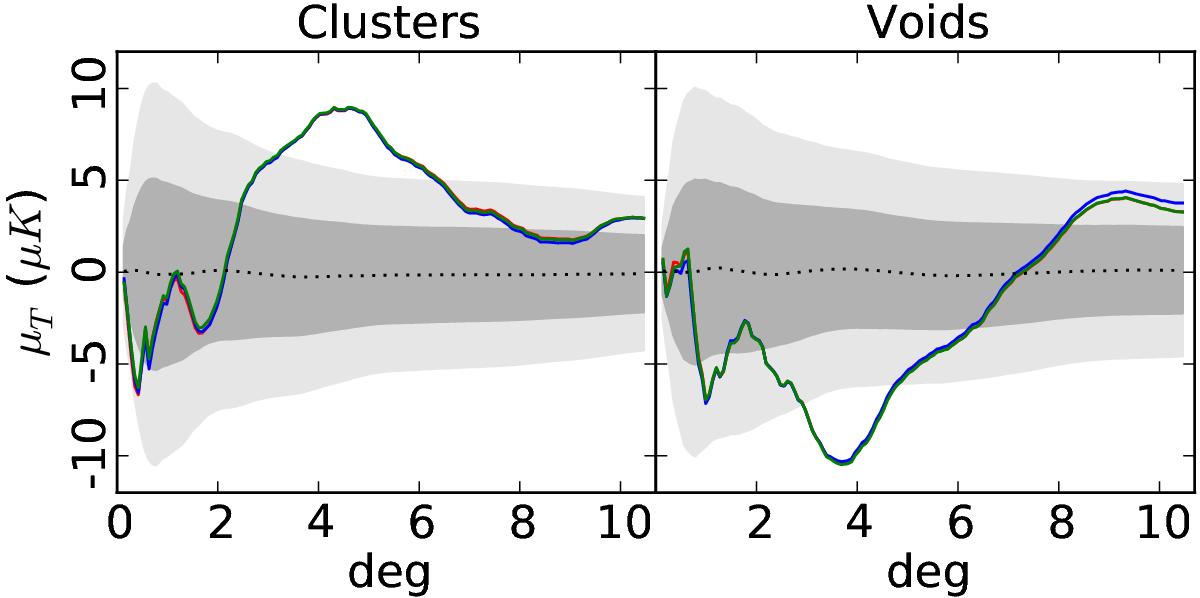
Mean photometry profiles of the stacked temperature patches at the supercluster (first panel) and supervoid (second panel) positions of the GR08 catalogue. The CMB data used are the 100 GHz (red), 143 GHz (blue), and 217 GHz (green) cleaned maps supplied by SEVEM. The dotted black line and shaded regions show the mean, ± 1σ and ± 2σ uncertainties of the null profiles, i.e., computed at the same locations as the real superstructures but in 1000 FFP8 simulations processed through the 143 GHzSEVEM pipeline.
Current usage metrics show cumulative count of Article Views (full-text article views including HTML views, PDF and ePub downloads, according to the available data) and Abstracts Views on Vision4Press platform.
Data correspond to usage on the plateform after 2015. The current usage metrics is available 48-96 hours after online publication and is updated daily on week days.
Initial download of the metrics may take a while.