Fig. 12
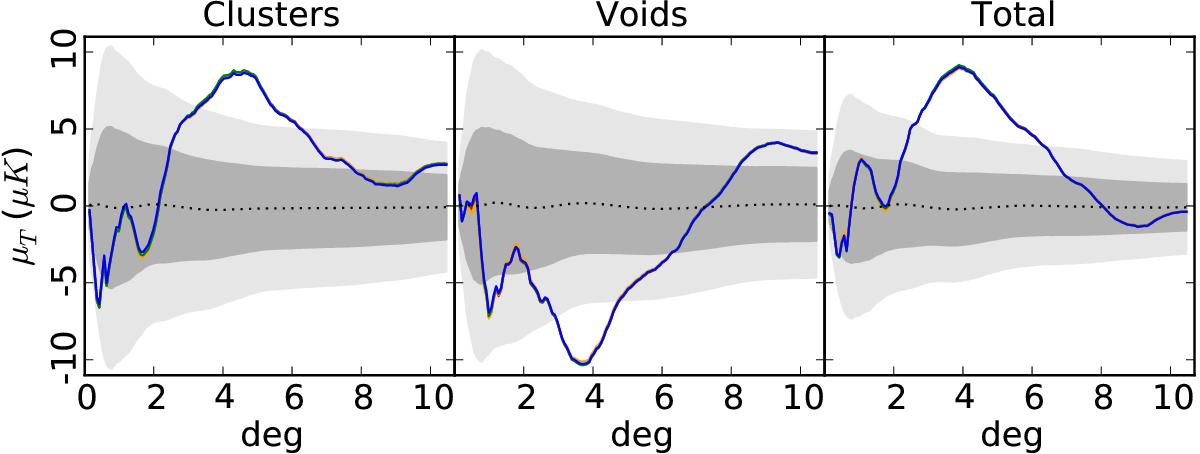
Photometry profiles of the stacked temperature patches at the supercluster (first panel) or supervoid (second panel) positions from the GR08 catalogue. The third panel shows the difference between cluster and void profiles. Coloured lines correspond to the different component separation methods: COMMANDER (red); NILC (orange); SEVEM (green); and SMICA (blue). Notice that the four lines are almost exactly on top of each other. The dotted black lines correspond to the mean values of the null profiles, i.e., computed at the same locations as the real superstructures, but in 1000 FFP8 simulations processed through the SEVEM pipeline. The shaded regions show the ± 1σ and ± 2σ uncertainties. Similar levels are obtained for the different component separation methods.
Current usage metrics show cumulative count of Article Views (full-text article views including HTML views, PDF and ePub downloads, according to the available data) and Abstracts Views on Vision4Press platform.
Data correspond to usage on the plateform after 2015. The current usage metrics is available 48-96 hours after online publication and is updated daily on week days.
Initial download of the metrics may take a while.