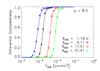
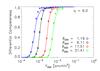
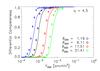
Fig. 6
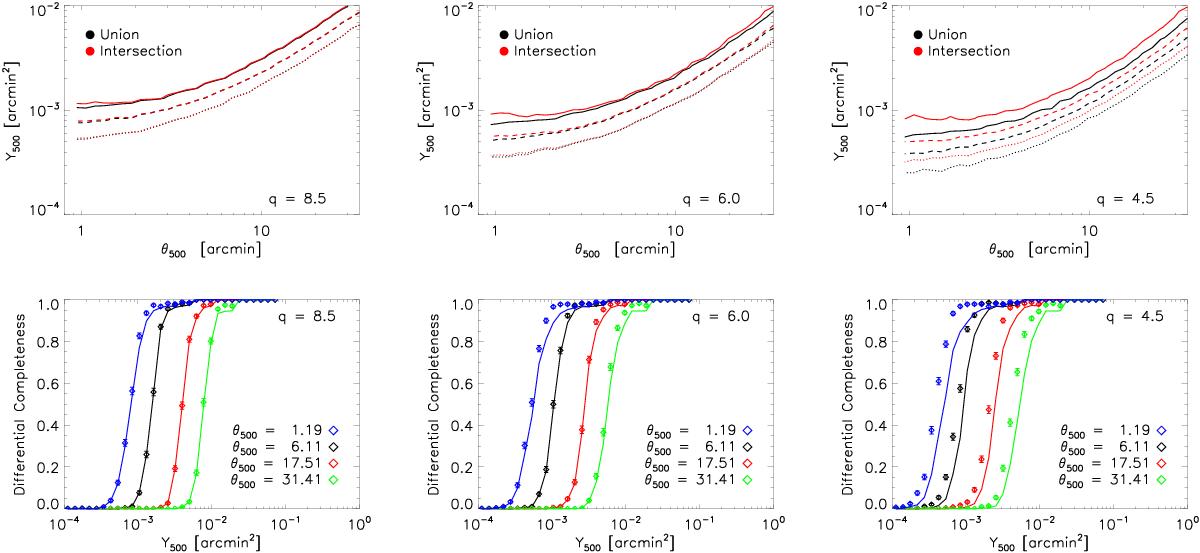
Completeness of the union and intersection samples at progressively lower S/N thresholds. From left to right, the thresholds are 8.5, 6.0 and 4.5 (the survey threshold). In the top panels, the dotted lines denote 15% completeness, the dashed lines 50%, and the solid lines 85% completeness. In the bottom panels, the union is denoted by the diamonds with Monte Carlo uncertainties based on binomial statistics, and the intersection is denoted by the solid lines.
Current usage metrics show cumulative count of Article Views (full-text article views including HTML views, PDF and ePub downloads, according to the available data) and Abstracts Views on Vision4Press platform.
Data correspond to usage on the plateform after 2015. The current usage metrics is available 48-96 hours after online publication and is updated daily on week days.
Initial download of the metrics may take a while.