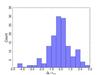
Fig. 28
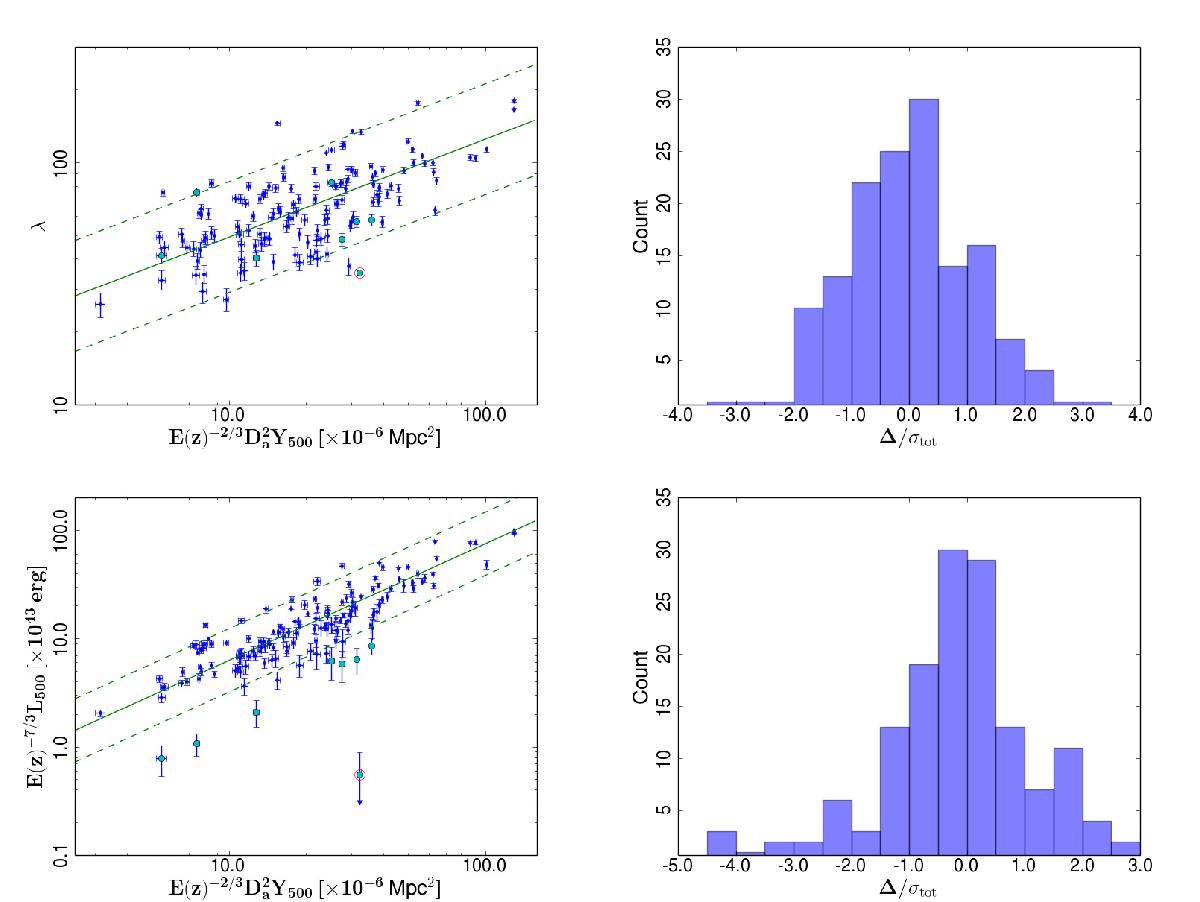
Properties in the Y500− λ (top panels) and Y500-L500 (bottom panels) planes for the Planck-redMaPPer sample at z< 0.2. Under-luminous candidates are denoted with cyan circles in the scatter plots to the left, which also show the best fit relation and the dispersion ± 2σtot. The circled red point is a cluster with contaminated Y signal. The right plots show the histograms of orthogonal deviation Δ⊥ for each relation.
Current usage metrics show cumulative count of Article Views (full-text article views including HTML views, PDF and ePub downloads, according to the available data) and Abstracts Views on Vision4Press platform.
Data correspond to usage on the plateform after 2015. The current usage metrics is available 48-96 hours after online publication and is updated daily on week days.
Initial download of the metrics may take a while.