Fig. 26
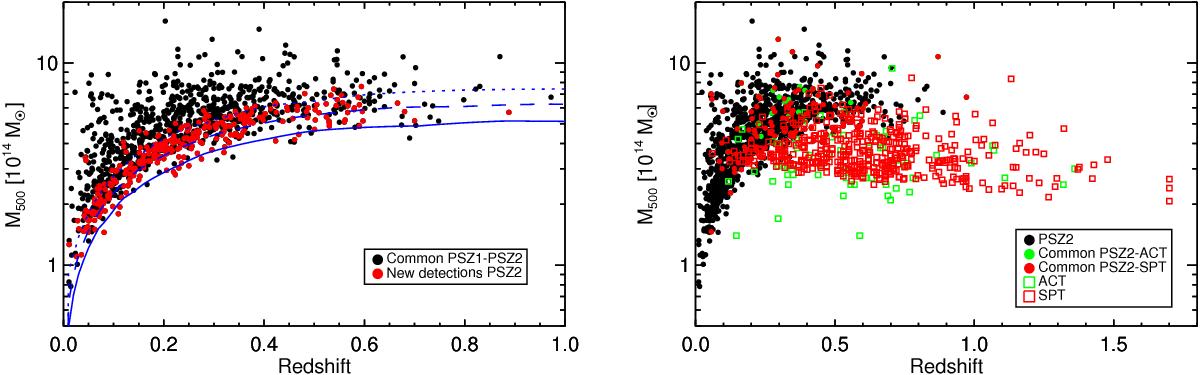
Left: distributionin the M500-z planeof the 1094 PSZ2 clusters with counterparts with known redshift. New PSZ2-detected clusters are indicated with red dots, while commmon PSZ1 and PSZ2 clusters are indicated by black dots. The solid, dashed, and dotted lines indicate, respectively, the 20%, 50%, and 80% survey completeness contours for the PSZ2. Right: distribution of the PSZ2 clusters with associated redshift in the M500−z plane compared to the SPT (Bleem et al. 2015) and ACT (Hasselfield et al. 2013) catalogues. Black circles represent PSZ2 clusters, while red and green filled circles mark common SPT/PSZ2 and ACT/PSZ2 clusters, respectively. The remaining SPT and ACT clusters not detected by Planck are shown with red and green empty squares.
Current usage metrics show cumulative count of Article Views (full-text article views including HTML views, PDF and ePub downloads, according to the available data) and Abstracts Views on Vision4Press platform.
Data correspond to usage on the plateform after 2015. The current usage metrics is available 48-96 hours after online publication and is updated daily on week days.
Initial download of the metrics may take a while.