Fig. 24
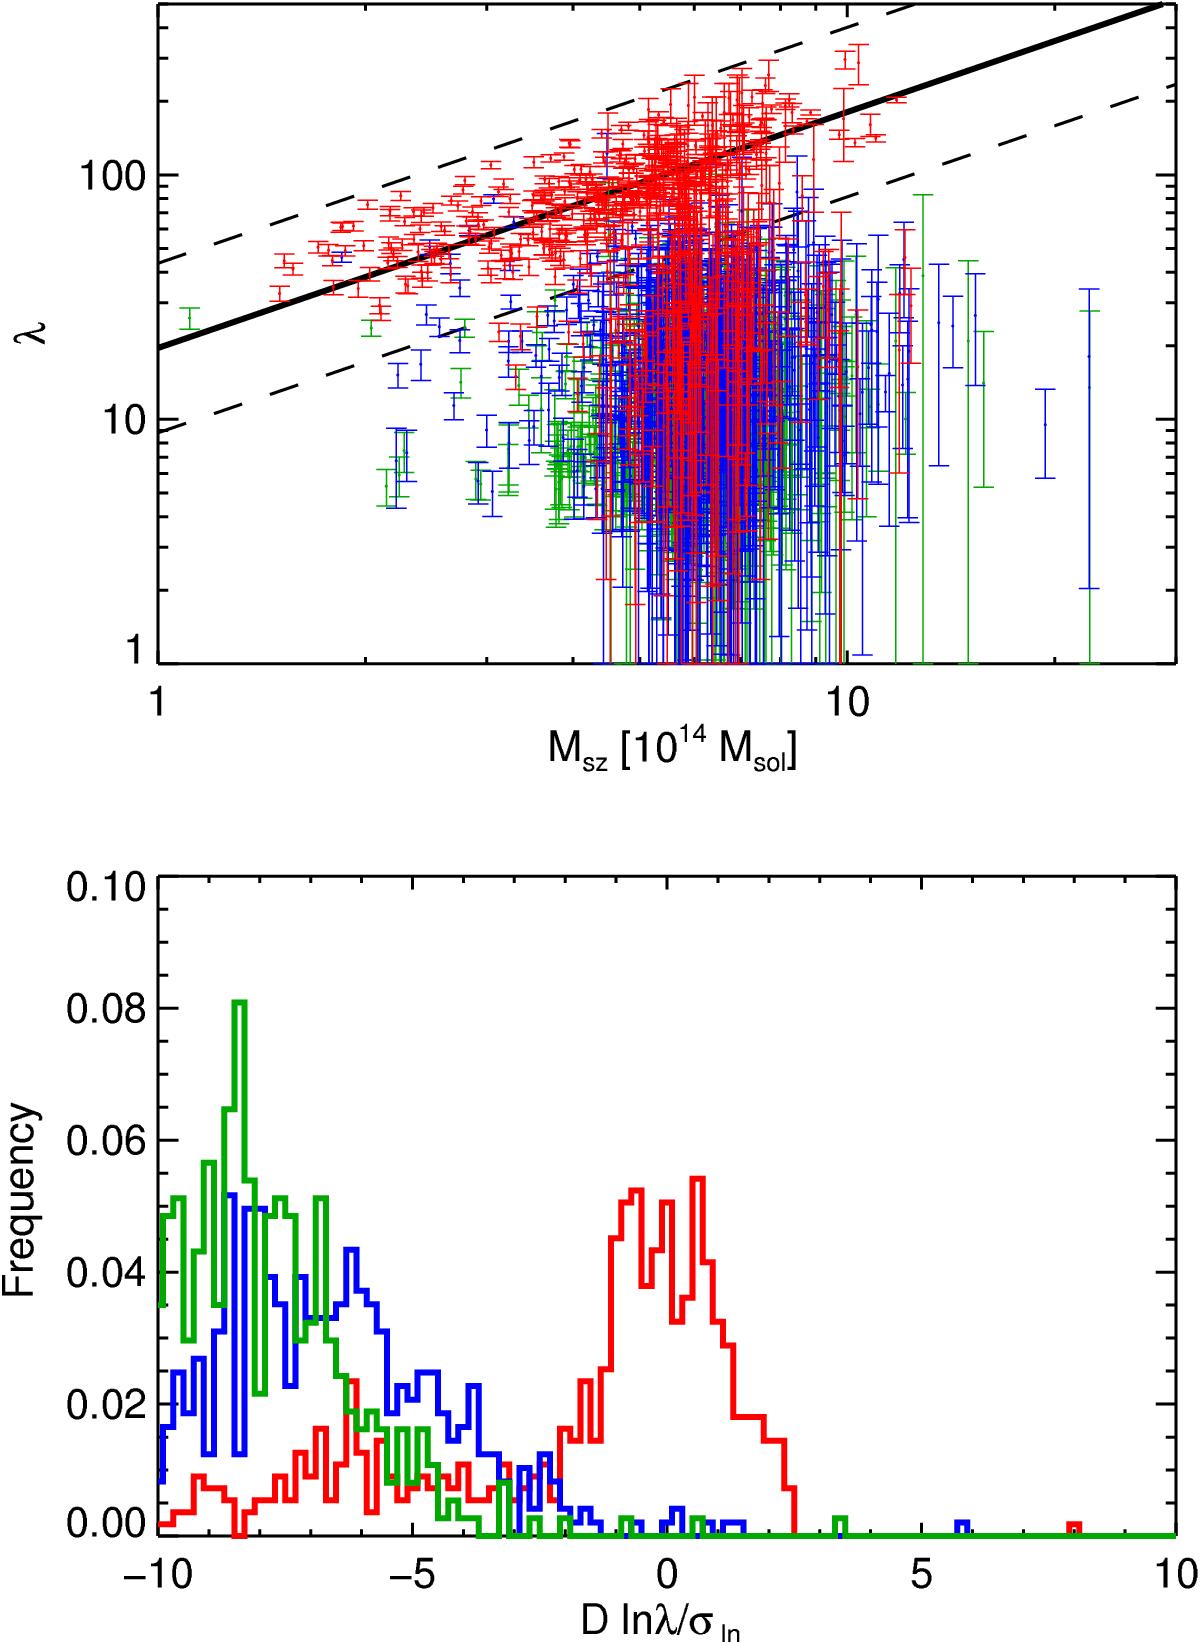
Distribution of positional matches within a 10 arcmin radius in the richness-MSZ plane. The red points in the upper panel represent the highest richness match, blue the second (when present) and green points the third-ranked richness match (when present). The mean scaling law from Rozo et al. (2015) is shown as the solid line, with the dashed lines delineating the ± 3σ band. In the lower panel, we show the distribution of these points relative to the mean relation, normalized to the logarithmic scatter. The red, blue and green histograms refer to the first-, second-, and third-ranked matches, respectively.

Current usage metrics show cumulative count of Article Views (full-text article views including HTML views, PDF and ePub downloads, according to the available data) and Abstracts Views on Vision4Press platform.
Data correspond to usage on the plateform after 2015. The current usage metrics is available 48-96 hours after online publication and is updated daily on week days.
Initial download of the metrics may take a while.