Fig. 22
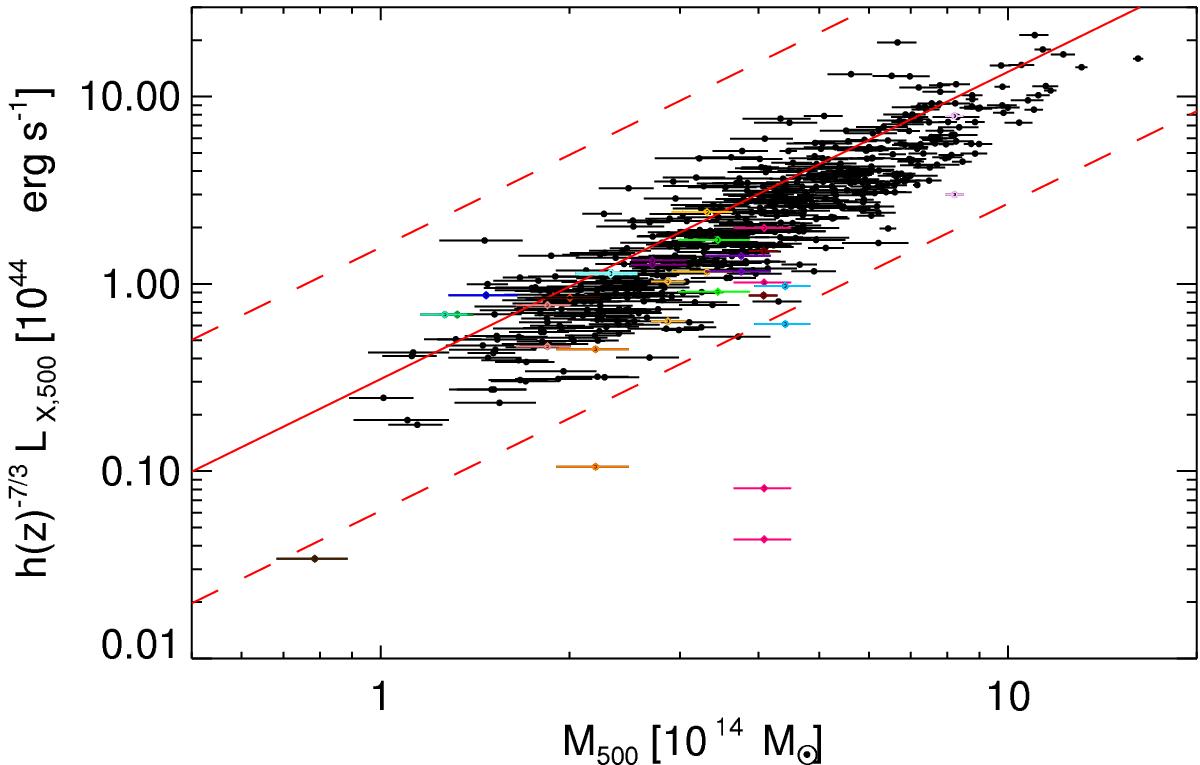
Comparison of candidates associated with the MCXC catalogue and the expected LX,500−M500 scaling relation (red line). The parallel dashed lines identify the region of the plane within 2σint from the expected scaling relation, where σint is the logarithmic intrinsic scatter of the relation we used. Black points are confirmed MCXC associations, while magenta squares mark the associations discarded by the L−M criterion. Pairs of coloured diamonds mark the two possible counterparts for objects with multiple associations.
Current usage metrics show cumulative count of Article Views (full-text article views including HTML views, PDF and ePub downloads, according to the available data) and Abstracts Views on Vision4Press platform.
Data correspond to usage on the plateform after 2015. The current usage metrics is available 48-96 hours after online publication and is updated daily on week days.
Initial download of the metrics may take a while.