Fig. 16
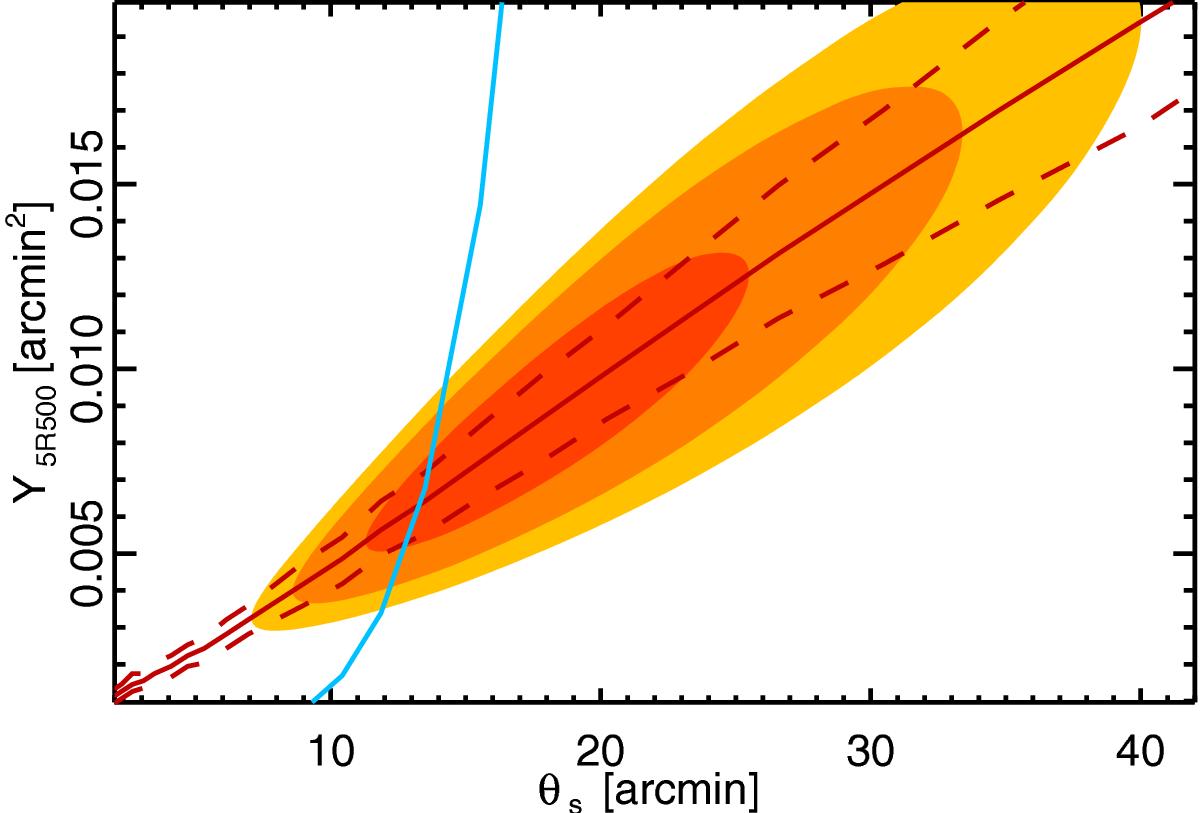
Illustration of the posterior probability contours in the Y5R500–θs plane for a cluster detected by Planck. The contours show the 68, 95 and 99% confidence levels. The red continuous line shows the ridge line of the contours, while the dashed lines are the ± 1σ probability value at each θS. The cyan line is the expected relation from Arnaud et al. (in prep.) at a given redshift.
Current usage metrics show cumulative count of Article Views (full-text article views including HTML views, PDF and ePub downloads, according to the available data) and Abstracts Views on Vision4Press platform.
Data correspond to usage on the plateform after 2015. The current usage metrics is available 48-96 hours after online publication and is updated daily on week days.
Initial download of the metrics may take a while.