Fig. 8
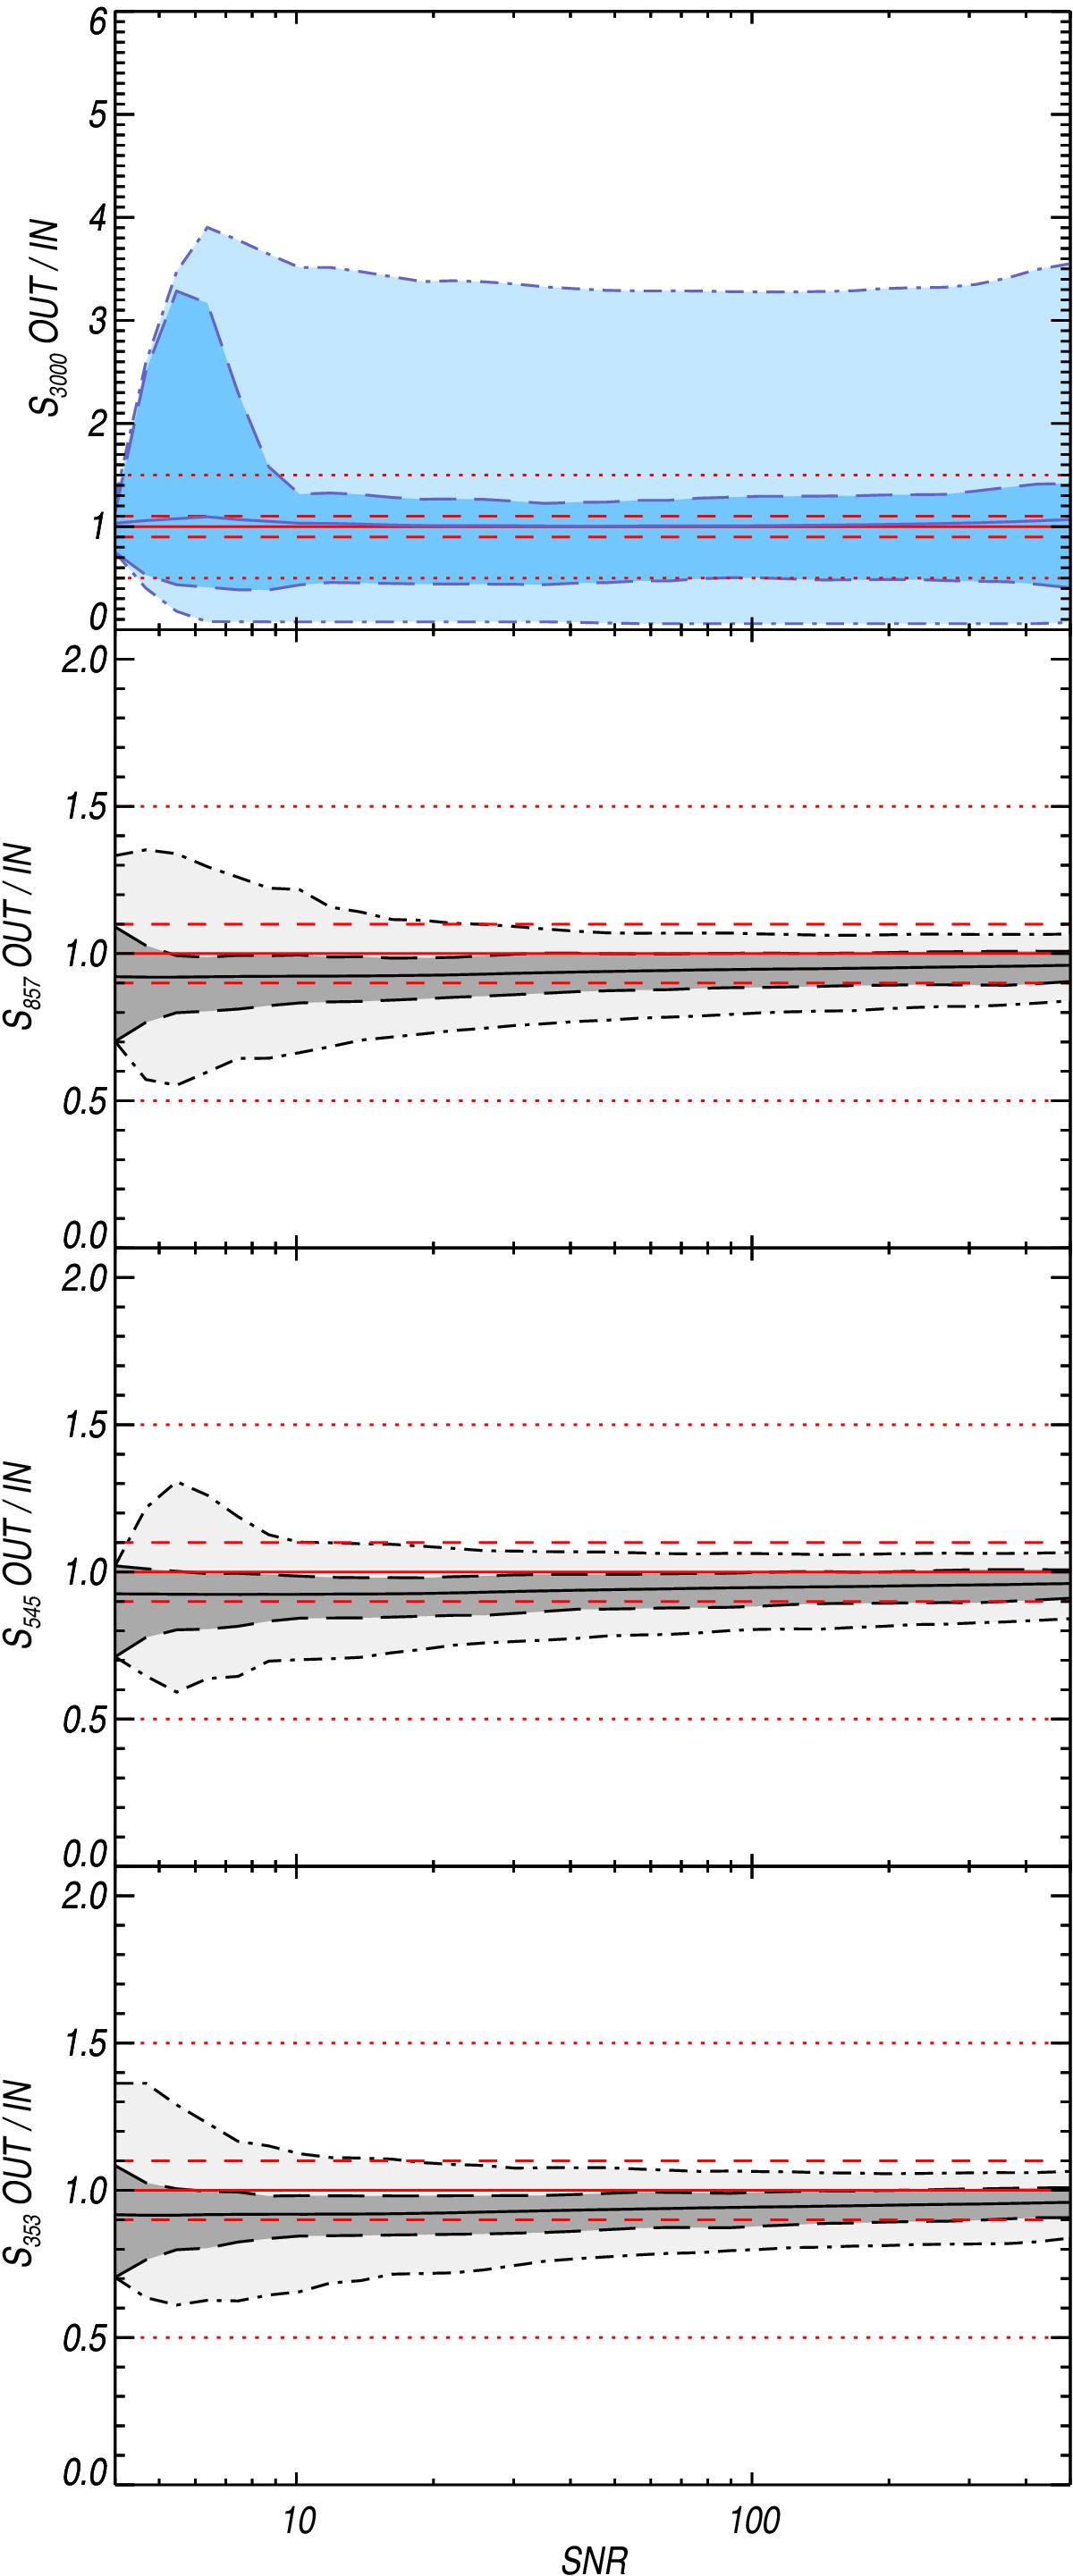
Ratio of the recovered (OUT) to injected (IN) flux densities for the simulated sources detected with FQ = 1 and 2. The ratio is given as a function of the detection S/N estimated from the cold residual maps. The light and dark grey shaded regions (denoted by the dot-dashed and long-dashed lines, respectively) highlight the behaviour of 95% and 68% of the sources, respectively, in each S/N bin. We note that at 3 THz (top panel) we only consider sources with FQ = 1, and the corresponding contours and shaded regions are highlighted in colour. The median of the ratio distributions are shown with a solid line. The 0%, 10% and 50% uncertainty levels are overlaid using a red solid, dashed and dotted line, respectively.
Current usage metrics show cumulative count of Article Views (full-text article views including HTML views, PDF and ePub downloads, according to the available data) and Abstracts Views on Vision4Press platform.
Data correspond to usage on the plateform after 2015. The current usage metrics is available 48-96 hours after online publication and is updated daily on week days.
Initial download of the metrics may take a while.