Fig. A.1
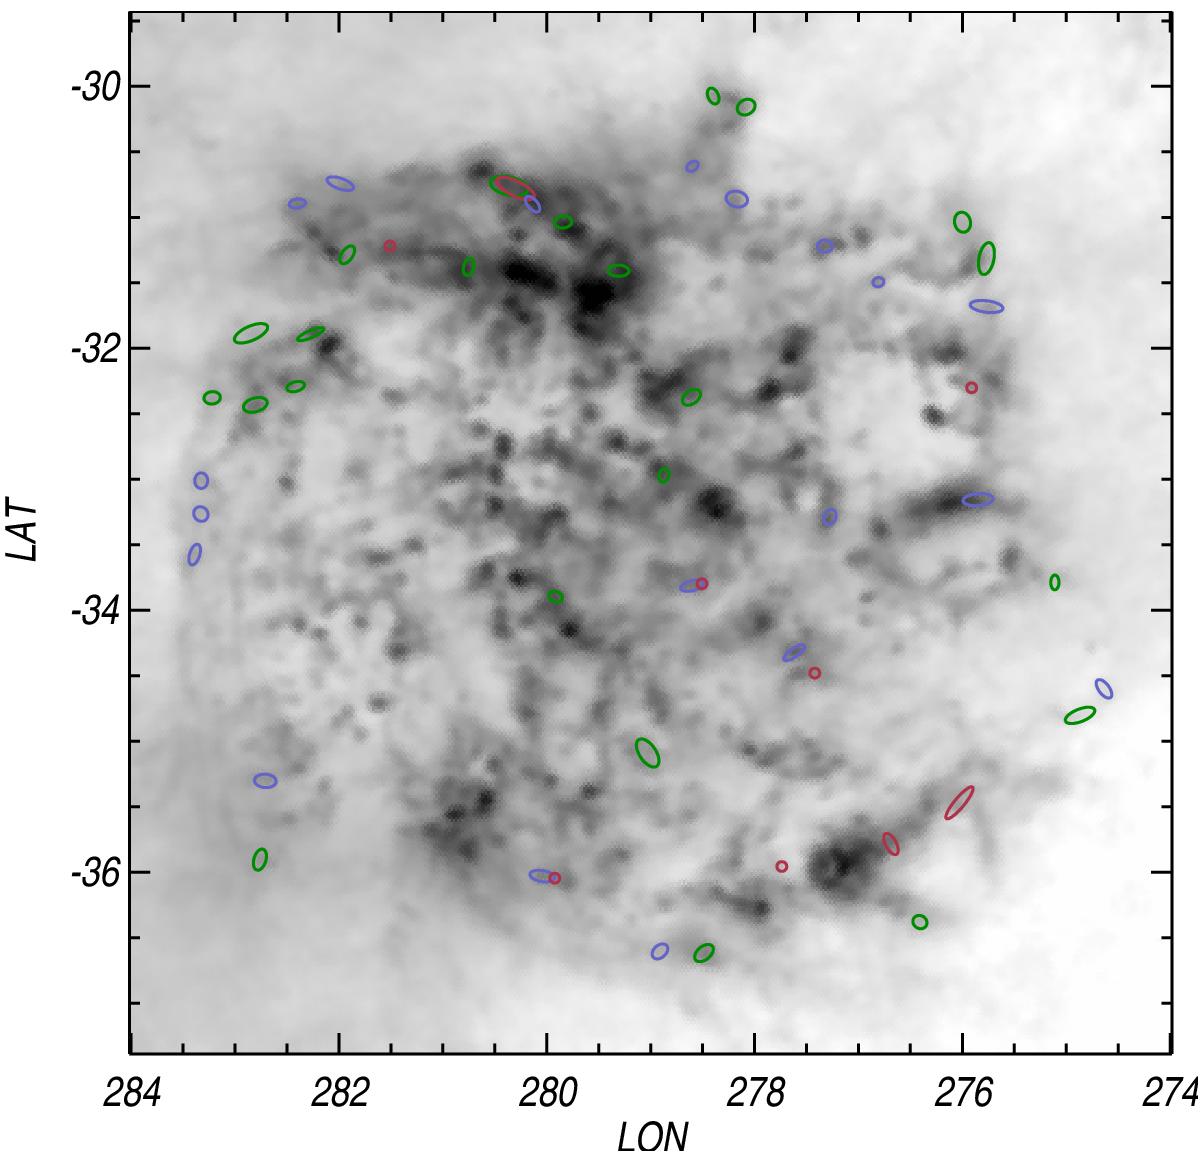
Distribution of the PGCC sources located in the LMC (in Galactic coordinates) for each FLUX_QUALITY category: “Reliable flux densities” (1, blue), “Missing 3 THz flux density” (2, green) and “Detection only” (3, pink). The grey scale image is the Planck intensity map at 857 GHz shown in log scale between 10-2 and 0.5 MJy sr-1.
Current usage metrics show cumulative count of Article Views (full-text article views including HTML views, PDF and ePub downloads, according to the available data) and Abstracts Views on Vision4Press platform.
Data correspond to usage on the plateform after 2015. The current usage metrics is available 48-96 hours after online publication and is updated daily on week days.
Initial download of the metrics may take a while.