Fig. 15
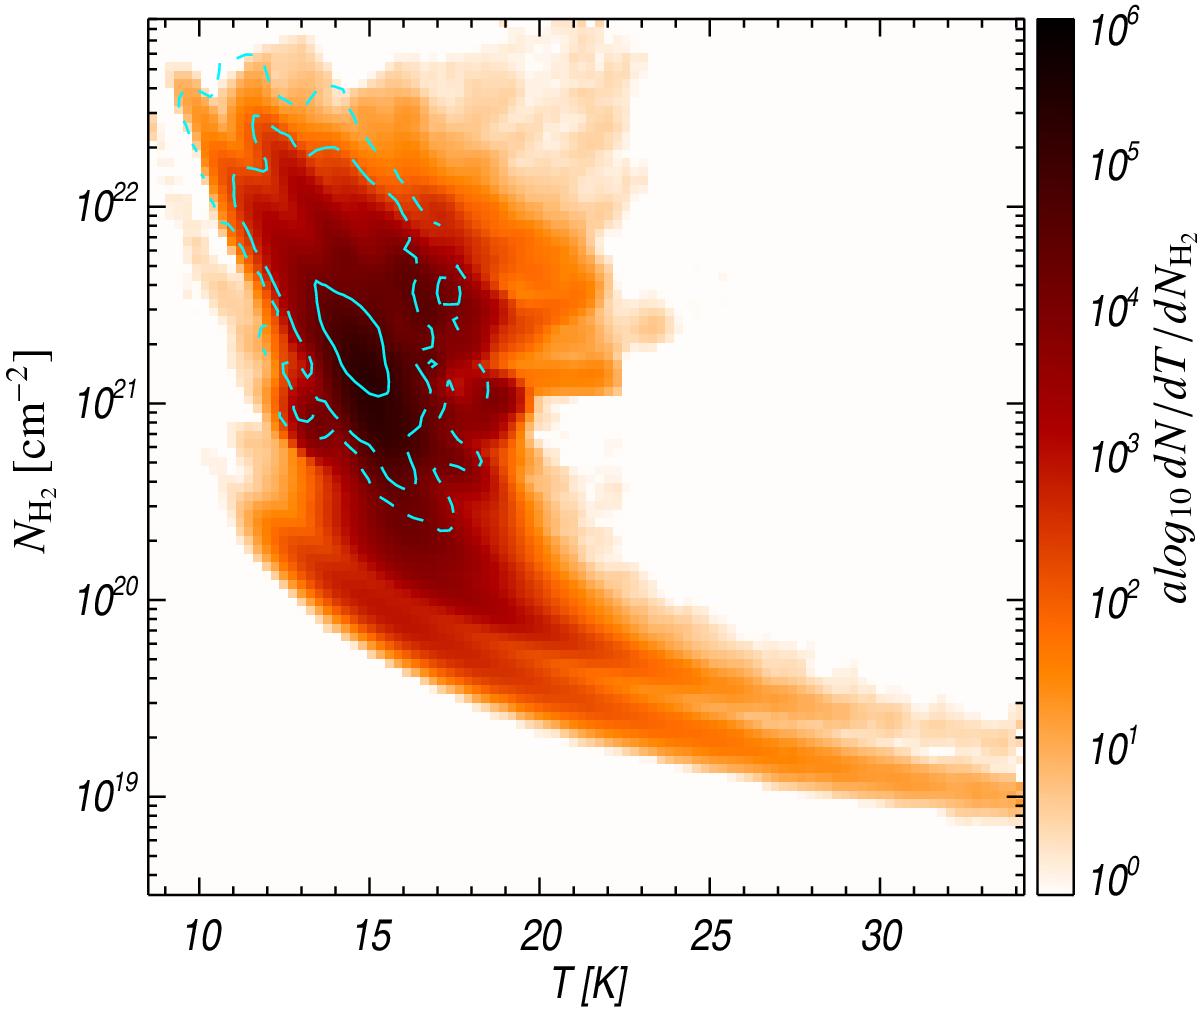
Temperature vs. column density two-dimensional distribution for all PGCC cold clumps followed up by Herschel in the HKP-GCC programme. The plotted data points are identified as IN and OUT: IN points are located inside the Planck clump solid angle, while the OUT points are located outside. The distribution of the OUT points is shown in colour, while the distribution of the IN points is denoted by cyan contours at three different levels: 10, 50 and 90% of the maximum.
Current usage metrics show cumulative count of Article Views (full-text article views including HTML views, PDF and ePub downloads, according to the available data) and Abstracts Views on Vision4Press platform.
Data correspond to usage on the plateform after 2015. The current usage metrics is available 48-96 hours after online publication and is updated daily on week days.
Initial download of the metrics may take a while.