Free Access
Fig. 13
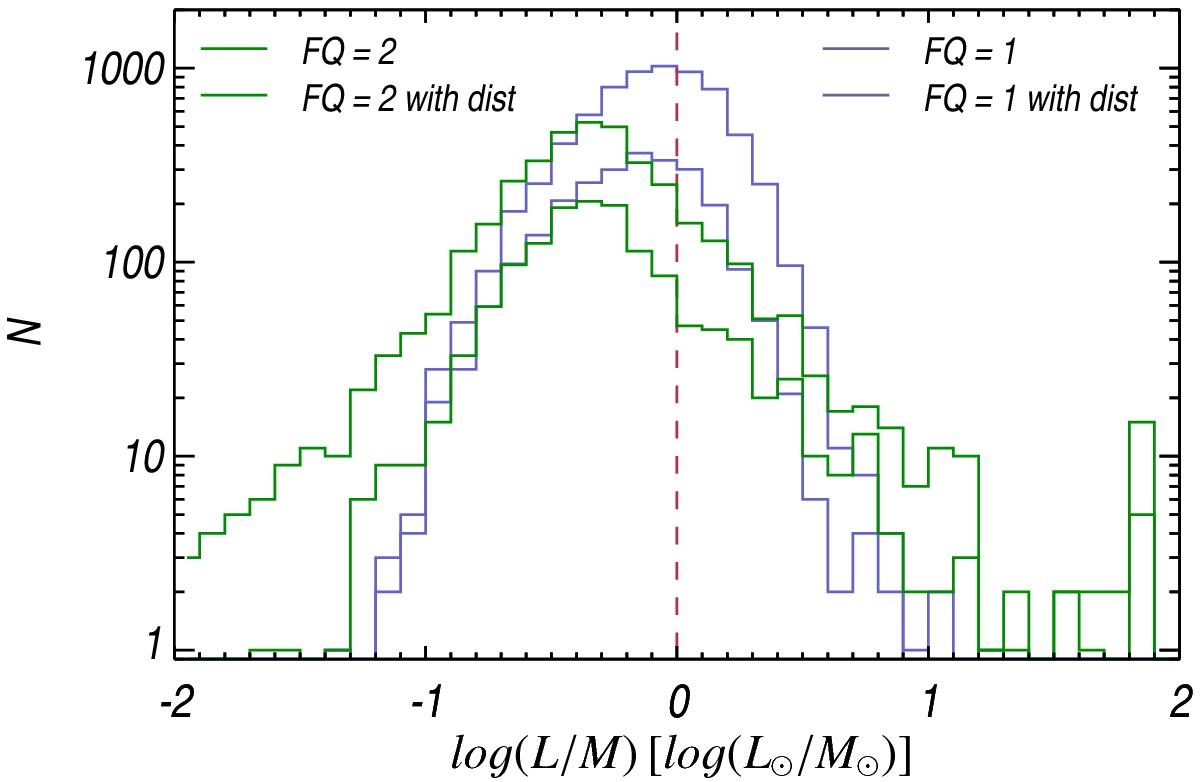
Distribution of the luminosity to mass ratio of the PGCC clumps for sources with FQ = 1(blue line) and FQ = 2 (green line). The dot-dot-dot-dashed line denotes the distribution for the subsample of sources with a reliable distance estimate.
Current usage metrics show cumulative count of Article Views (full-text article views including HTML views, PDF and ePub downloads, according to the available data) and Abstracts Views on Vision4Press platform.
Data correspond to usage on the plateform after 2015. The current usage metrics is available 48-96 hours after online publication and is updated daily on week days.
Initial download of the metrics may take a while.