Fig. 12
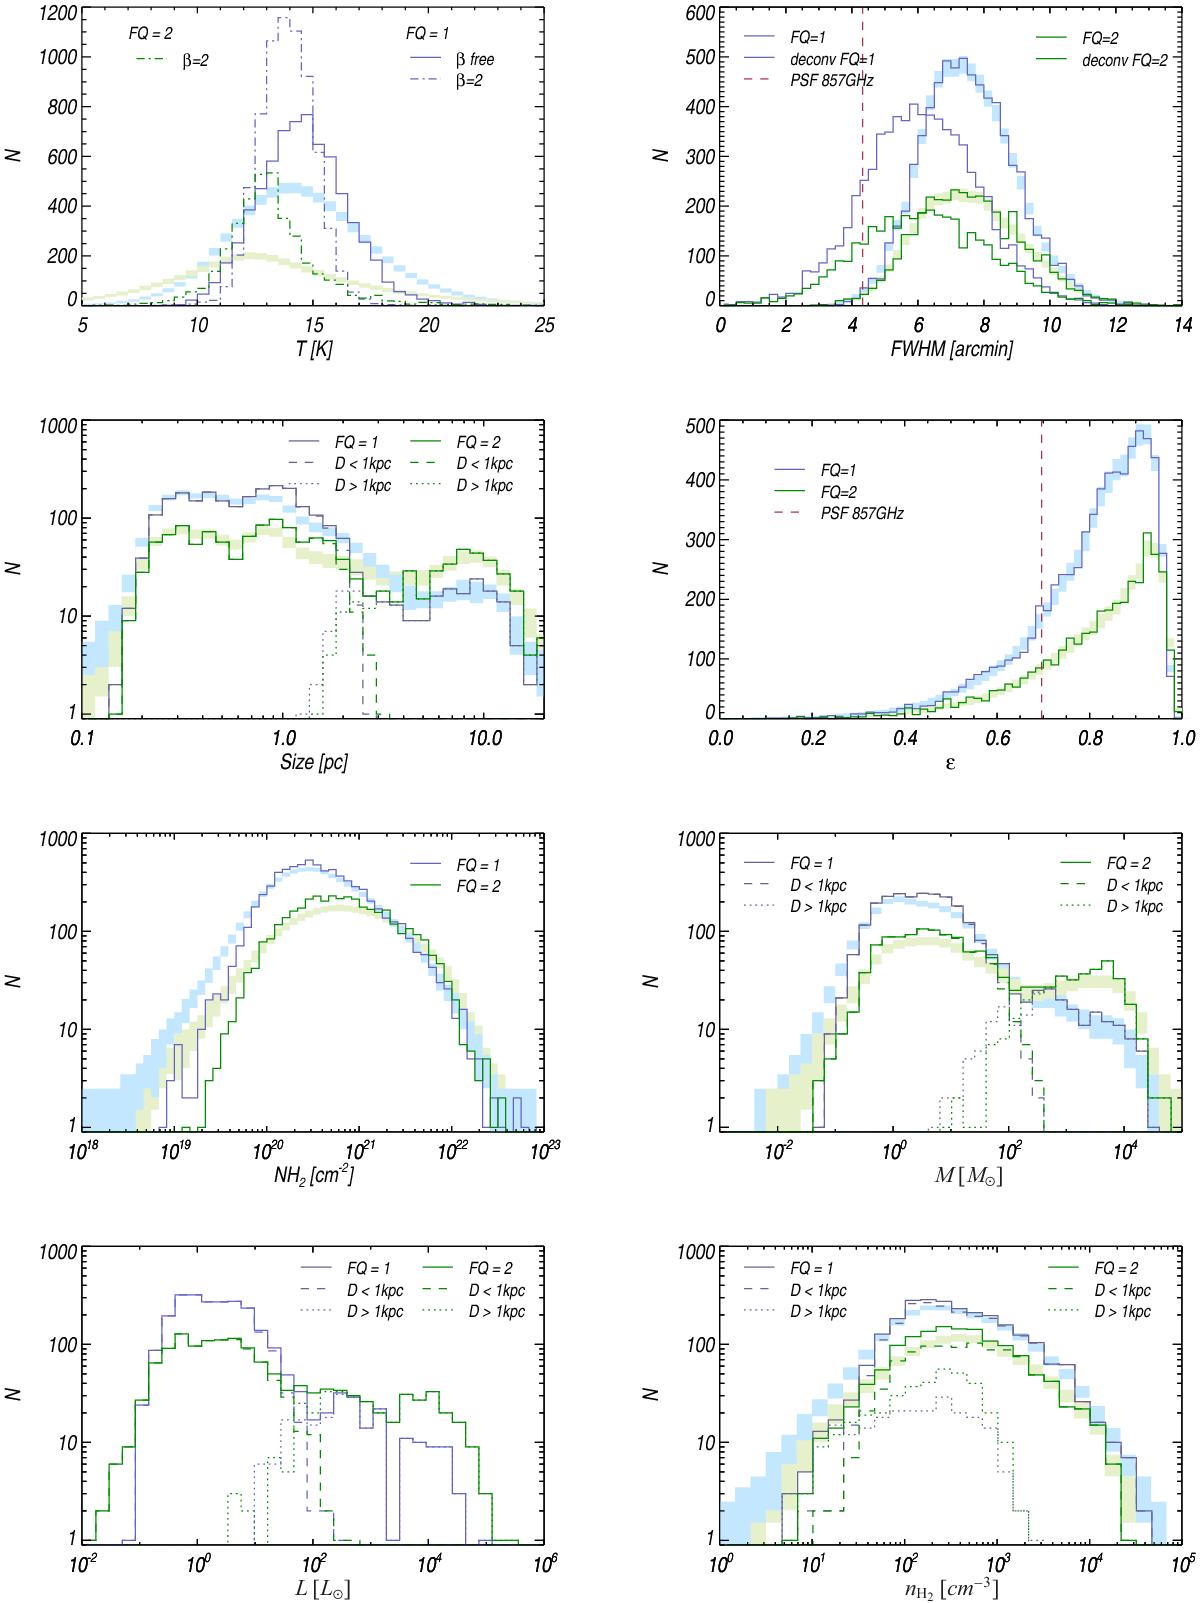
Distribution of the physical properties of the PGCC objects with FQ = 1 (blue) and FQ = 2 (green). The coloured shaded regions provide an estimate of the impact of the individual uncertainties on the statistical distribution at a 1σ dispersion level around the mean value obtained from 10 000 MC realizations (see Sect. 6 for more details). The temperature distribution is shown for two temperature estimates, i.e., using a free emissivity spectral index β (solid line) or a fixed β = 2 (dot-dashed line). The distribution of the intrinsic size, after deconvolution, is shown on the top right panel in dot-dot-dot-dashed line. The distributions of the physical size, mass, mean density and luminosity of the clumps are provided for sources with reliable distance estimates (DIST_QUALITY=1 or 2). These distributions are also shown separately for sources at solar distances smaller or larger than 1 kpc from the Sun, in dashed and dotted lines, respectively.
Current usage metrics show cumulative count of Article Views (full-text article views including HTML views, PDF and ePub downloads, according to the available data) and Abstracts Views on Vision4Press platform.
Data correspond to usage on the plateform after 2015. The current usage metrics is available 48-96 hours after online publication and is updated daily on week days.
Initial download of the metrics may take a while.