Fig. 7
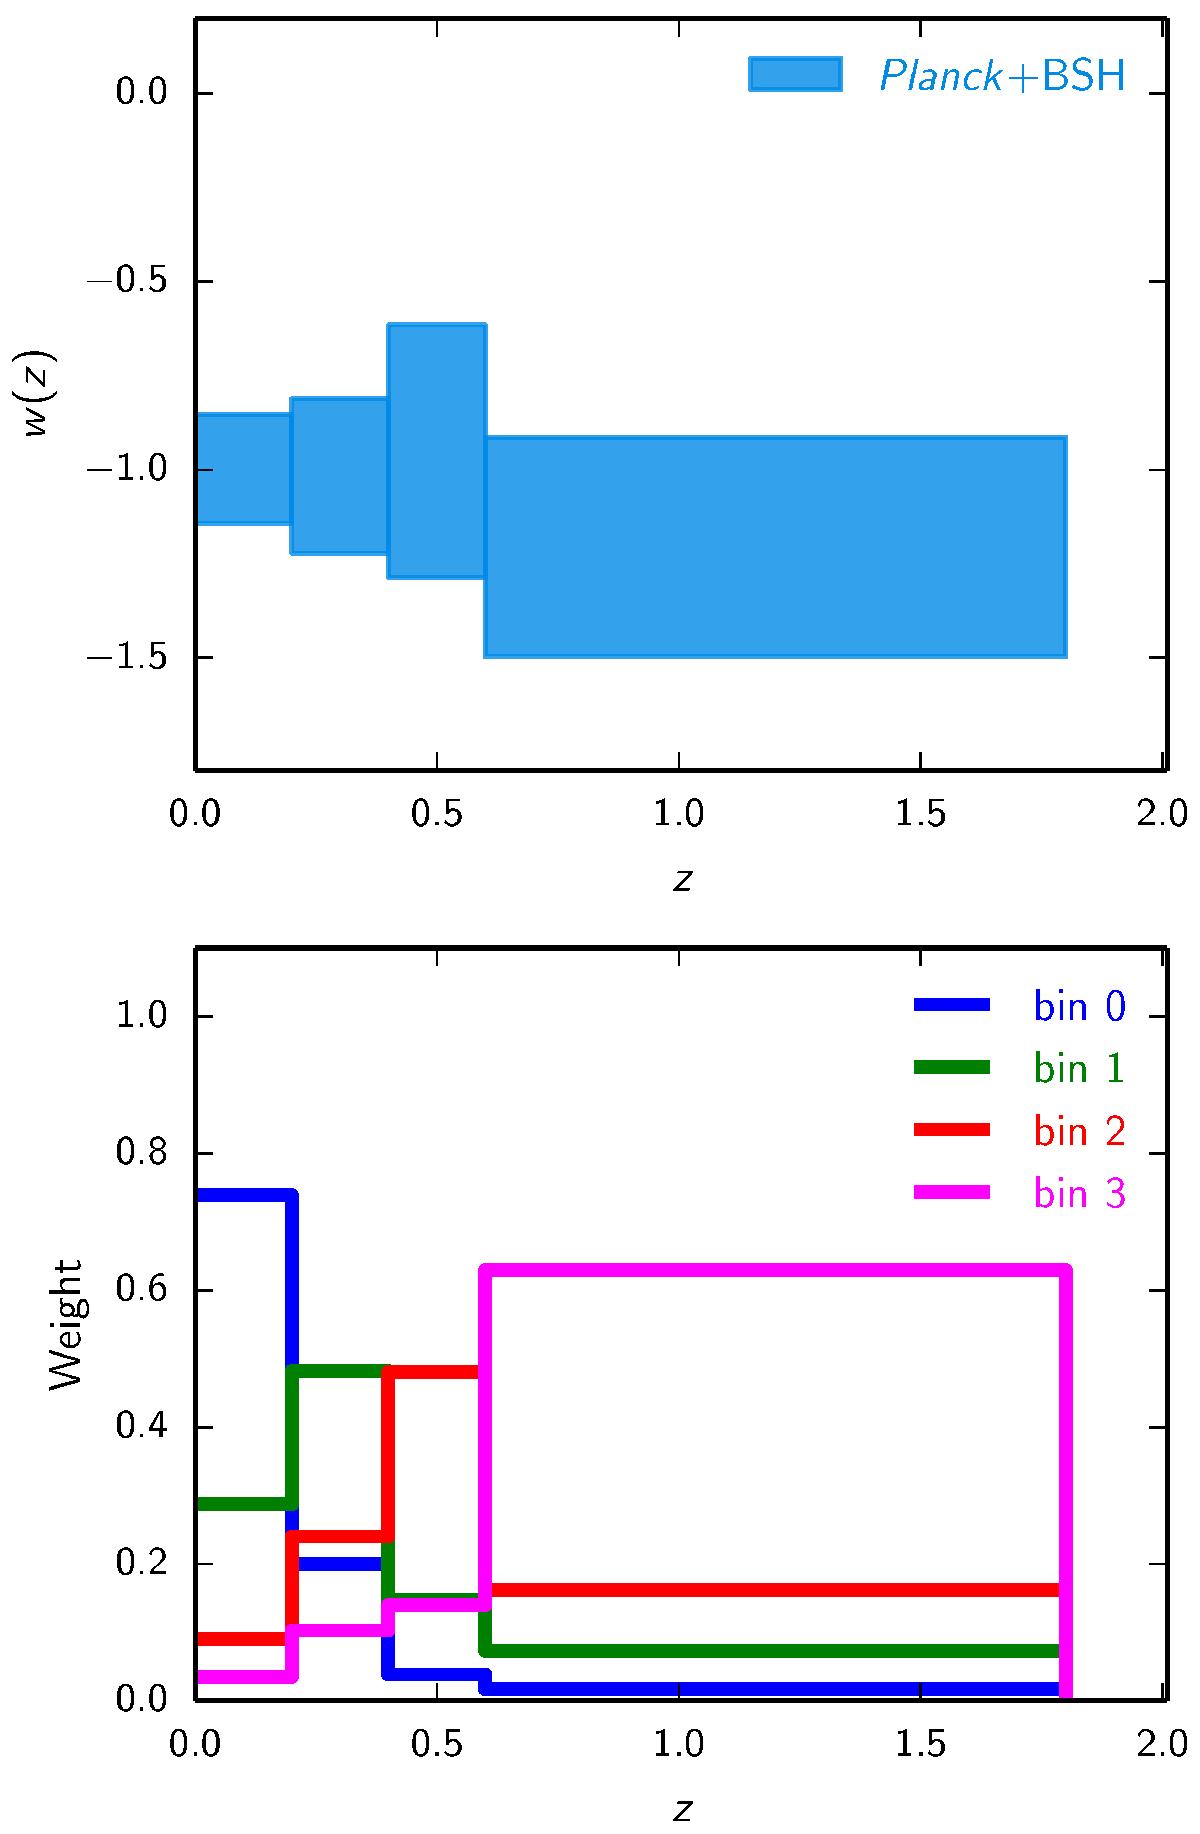
PCA analysis constraints (described in Sect. 5.1.3). The top panel shows the reconstructed equation of state w(z) after the PCA analysis. Vertical error bars correspond to mean and standard deviations of the q vector parameters, while horizontal error bars are the amplitude of the original binning. The bins are not exactly independent but are rather smeared out as illustrated in the bottom panel. The bottom panel shows the PCA corresponding weights on w(z) as a function of redshift for the combination Planck TT+lowP+BSH. In other words, error bars in the top panel correspond therefore to the errors in the q parameters, which are linear combinations of the p parameters, i.e. a smeared out distribution with weights shown in the lower panel.
Current usage metrics show cumulative count of Article Views (full-text article views including HTML views, PDF and ePub downloads, according to the available data) and Abstracts Views on Vision4Press platform.
Data correspond to usage on the plateform after 2015. The current usage metrics is available 48-96 hours after online publication and is updated daily on week days.
Initial download of the metrics may take a while.