Fig. 5
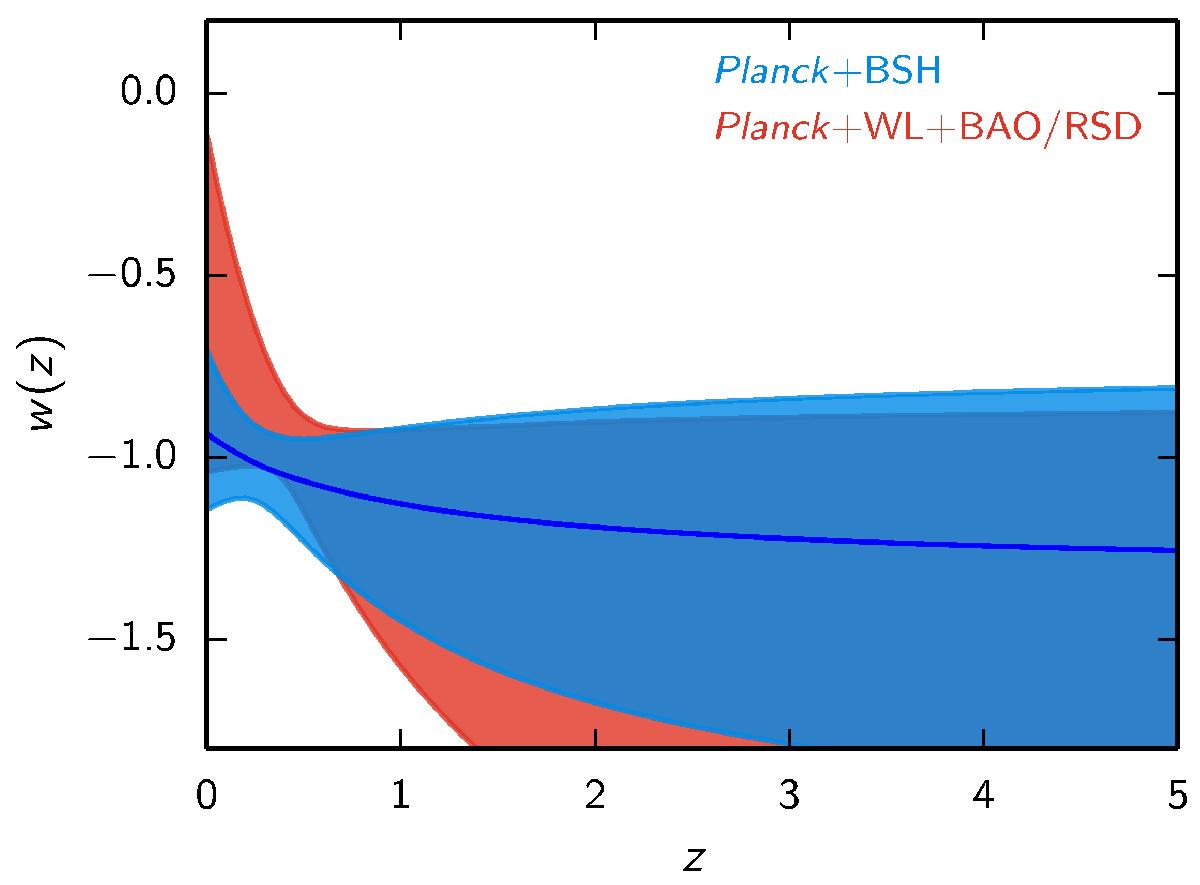
Reconstructed equation of state w(z) as a function of redshift (see Sect. 5.1.1), when assuming a Taylor expansion of w(z) to first-order (N = 1 in Eq. (19)), for different combinations of the data sets. The coloured areas show the regions which contain 95% of the models. The central blue line is the median line for Planck TT+lowP+BSH. Here Planck indicates Planck TT+lowP.
Current usage metrics show cumulative count of Article Views (full-text article views including HTML views, PDF and ePub downloads, according to the available data) and Abstracts Views on Vision4Press platform.
Data correspond to usage on the plateform after 2015. The current usage metrics is available 48-96 hours after online publication and is updated daily on week days.
Initial download of the metrics may take a while.