Fig. 16
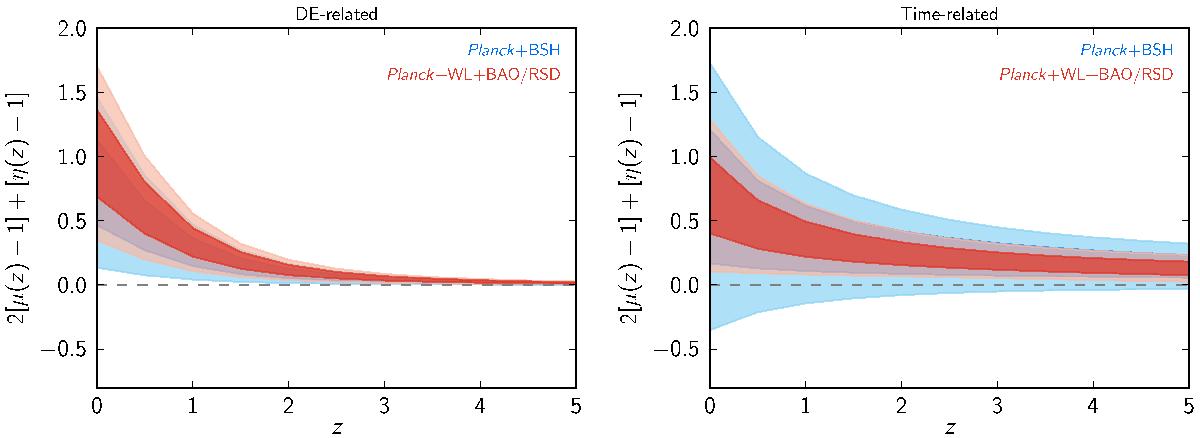
Redshift dependence of the function 2 [μ(z,k)−1] + [η(z,k)−1], defined in Eqs. (46) and (47), which corresponds to the maximum degeneracy line identified within the 2 dimensional posterior distributions. This combination shows the strongest allowed tension with ΛCDM. The left panel refers to the DE-related case while the right panel refers to the time-related evolution (see Sect. 5.2.2). In both panels, no scale dependence is considered. The coloured areas show the regions containing 68% and 95% of the models. In the labels, Planck stands for Planck TT+lowP.
Current usage metrics show cumulative count of Article Views (full-text article views including HTML views, PDF and ePub downloads, according to the available data) and Abstracts Views on Vision4Press platform.
Data correspond to usage on the plateform after 2015. The current usage metrics is available 48-96 hours after online publication and is updated daily on week days.
Initial download of the metrics may take a while.