Fig. 14
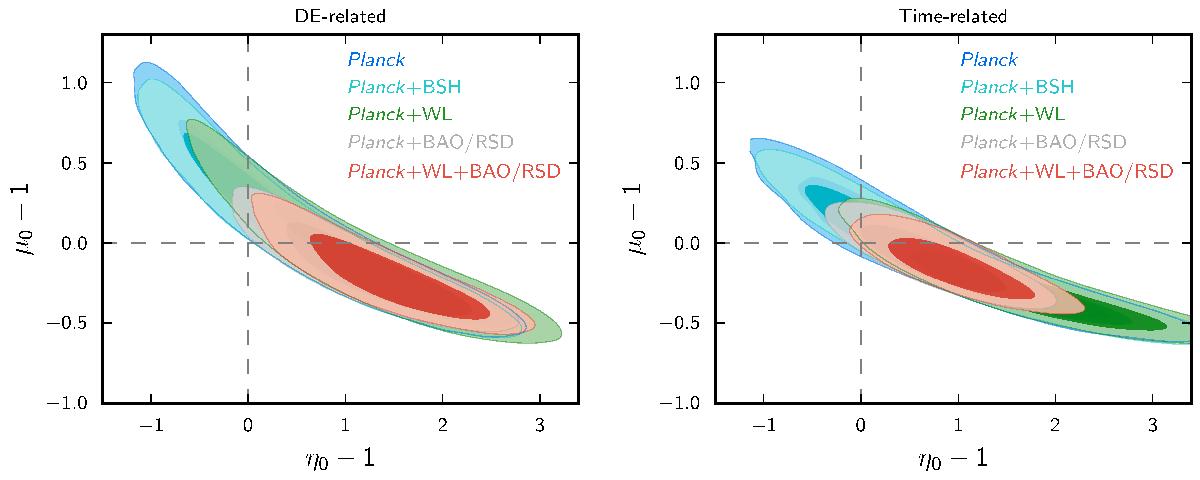
68% and 95% contour plots for the two parameters { μ0−1,η0−1 } obtained by evaluating Eqs. (46) and (47) at the present time when no scale dependence is considered (see Sect. 5.2.2). We consider both the DE-related (left panel) and time-related evolution cases (right panel). Results are shown for the scale-independent case (c1 = c2 = 1). In the labels, Planck stands for Planck TT+lowP.
Current usage metrics show cumulative count of Article Views (full-text article views including HTML views, PDF and ePub downloads, according to the available data) and Abstracts Views on Vision4Press platform.
Data correspond to usage on the plateform after 2015. The current usage metrics is available 48-96 hours after online publication and is updated daily on week days.
Initial download of the metrics may take a while.