Fig. B.3
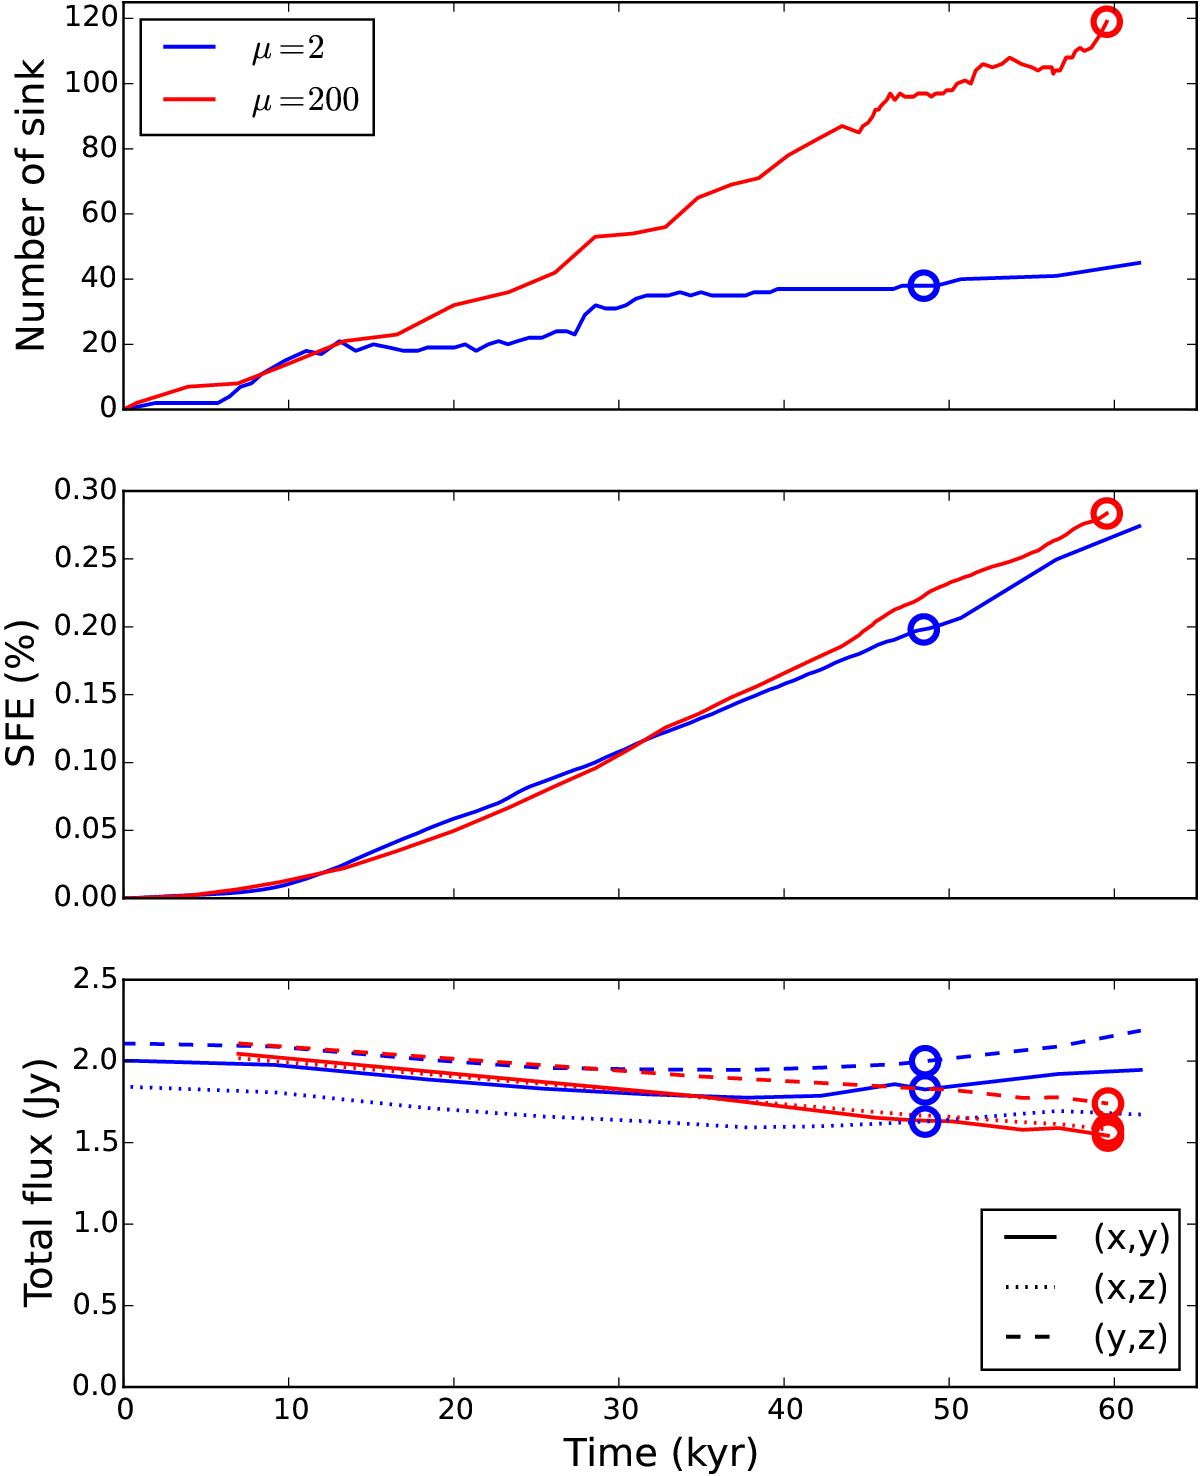
From top to bottom: evolution with time of the number of sink particles, of the SFE, and of the total flux emission at 278 GHz (within a total area of 80 000 AU × 80 000 AU) for the two models after the creation of the first sink. The circles indicate the time at which the simulations are post-processed. In the bottom panel, the different lines correspond to the different projection planes as illustrated in the bottom right corner.
Current usage metrics show cumulative count of Article Views (full-text article views including HTML views, PDF and ePub downloads, according to the available data) and Abstracts Views on Vision4Press platform.
Data correspond to usage on the plateform after 2015. The current usage metrics is available 48-96 hours after online publication and is updated daily on week days.
Initial download of the metrics may take a while.