Fig. B.1
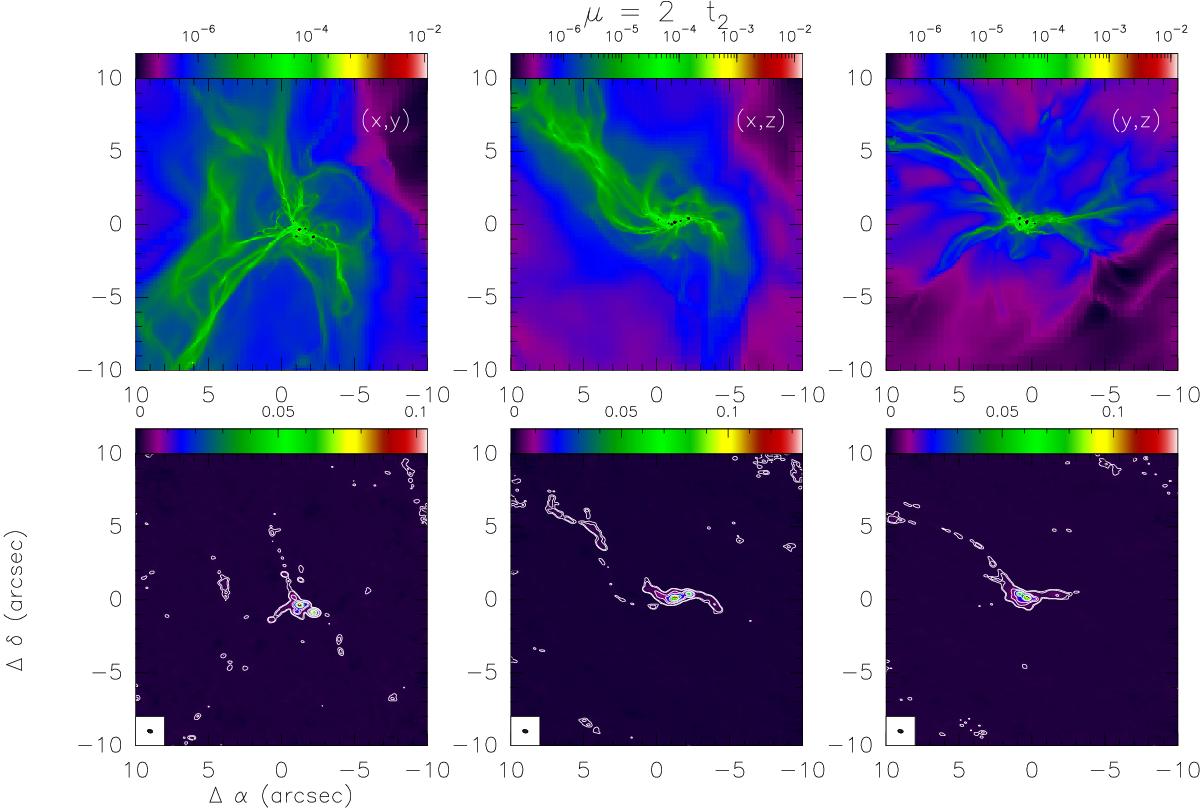
Top panels: show the thermal dust continuum emission map at frequency 278 GHz predicted by the models of Commerçon et al. (2011), which reproduce the gravitational collapse of a 300 M⊙ clump in case of strong magnetic support (μ = 2) at time t2 = 48 500 yr after the birth of the first protostar (see main text for details). In the bottom panels, we show the models after processing in the CASA simulator, adopting the same observational conditions as for the real observations. Units of the colour-scale are Jansky/beam. Contour levels are 0.6, 1, 5, 10, 30, and 50 mJy beam-1 in all bottom panels.
Current usage metrics show cumulative count of Article Views (full-text article views including HTML views, PDF and ePub downloads, according to the available data) and Abstracts Views on Vision4Press platform.
Data correspond to usage on the plateform after 2015. The current usage metrics is available 48-96 hours after online publication and is updated daily on week days.
Initial download of the metrics may take a while.