Fig. 2
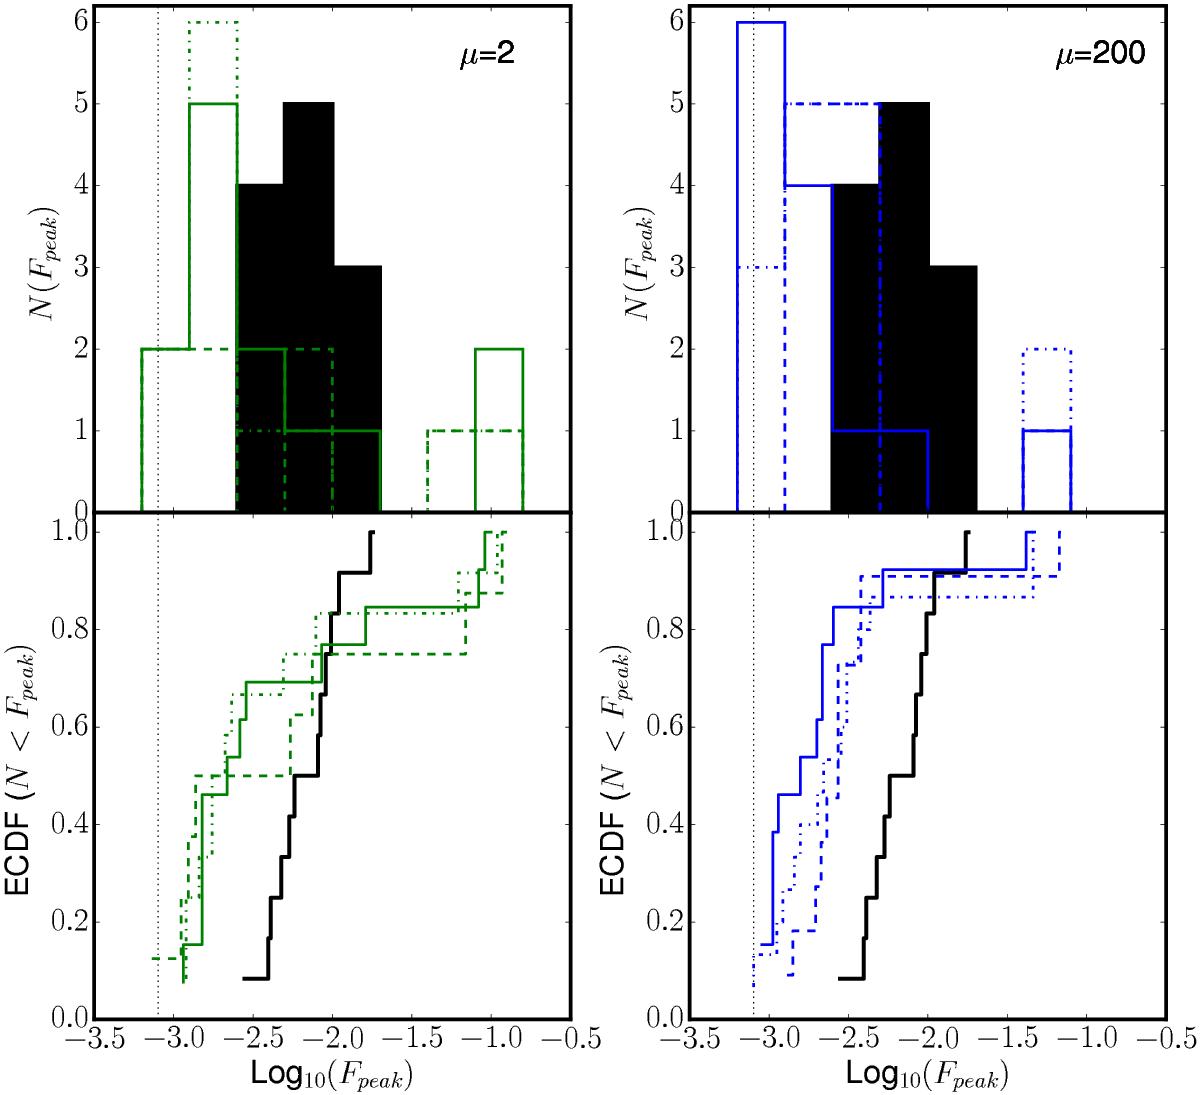
Top panels: histograms showing the distribution of the peak fluxes (Fpeak) of the fragments identified in the ALMA image of I16061c1 (black), and in the synthetic images for μ = 2 (green, left) and μ = 200 (blue, right). Bottom panels: empirical cumulative distribution function (ECDF) of the quantities plotted in the top panels. The black line corresponds to the ALMA data; the green and blue lines indicate the strong and weak field cases, respectively, projected on the three planes. In all panels, the different line style indicates the projection plane: solid = (x, y); dot-dashed = (x, z); dashed = (y, z). The vertical dotted line corresponds to 0.8 mJy, which is approximately five times the rms noise level in both the real and synthetic maps. Note that the μ = 2 model spans the observations, while the μ = 200 model is strongly biased towards fragments with masses lower than those observed.
Current usage metrics show cumulative count of Article Views (full-text article views including HTML views, PDF and ePub downloads, according to the available data) and Abstracts Views on Vision4Press platform.
Data correspond to usage on the plateform after 2015. The current usage metrics is available 48-96 hours after online publication and is updated daily on week days.
Initial download of the metrics may take a while.