Fig. 1
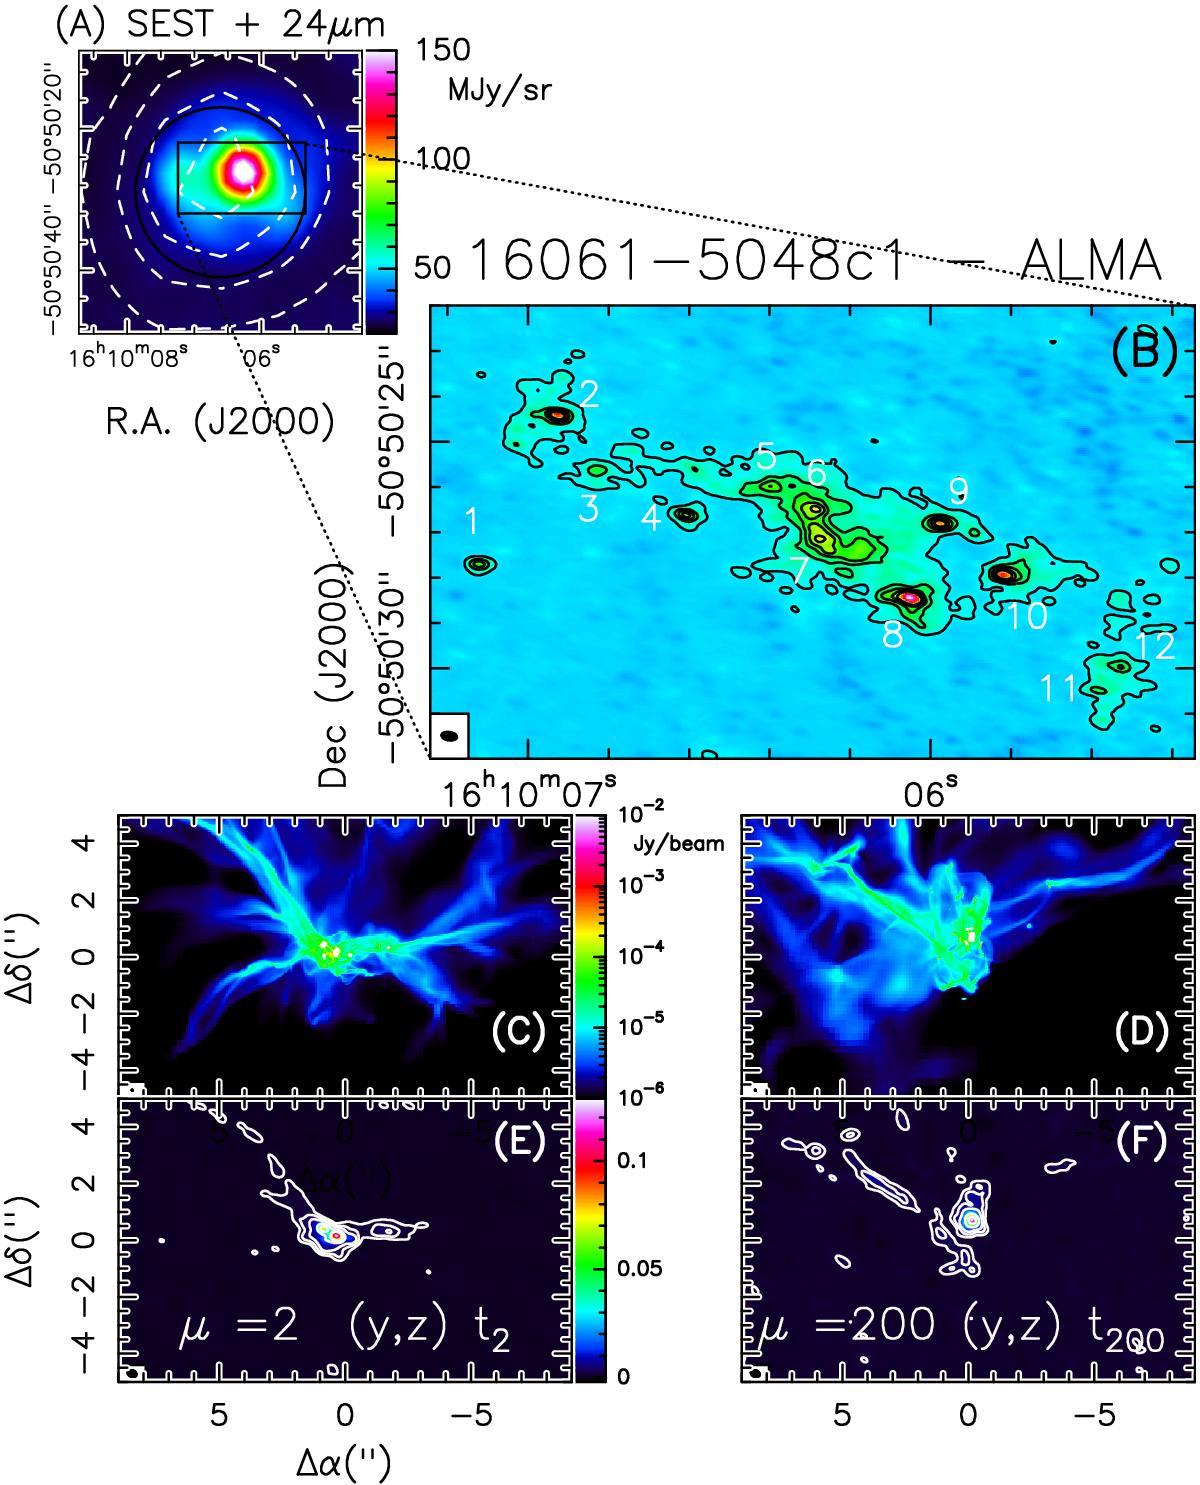
Panel A): dust continuum emission map (dashed contours) obtained with the SEST telescope with an angular resolution of 24′′ at 1.2 mm towards I16061c1 (Beltrán et al. 2006). The map is superimposed on the Spitzer-MIPS image at 24 μm (in units of MJy/sr). The circle indicates the ALMA primary beam at 278 GHz (~ 24′′). Panel B): enlargement of the rectangular region indicated in panel A), showing the contour map of the thermal dust continuum emission at frequency 278 GHz detected with ALMA, in flux density units. The first contour level and the spacing between two adjacent contours both correspond to the 3σ rms of the image (0.54 mJy/beam). The cross marks the phase centre. The ellipse in the bottom left corner shows the synthesized beam, and corresponds to 0.36′′×0.18′′ (Position Angle = 86°). The numbers indicate the twelve identified fragments (see Sect. 3). Panel C): simulations of the thermal dust emission at 278 GHz predicted by the models of Commerçon et al. (2011), which reproduce the gravitational collapse of a 300 M⊙ clump in case of strong magnetic support (μ = 2), obtained at time t2 (see text), projected on a plane perpendicular to the direction of the magnetic field. Panel D): same as panel C) for the case μ = 200 (weak magnetic support). Panel E): synthetic ALMA images of the models presented in panel C). The contours correspond to 0.54, 1.2, 2, 5, 10, 30, and 50 mJy/beam. Panel F) same as panel E) for the case μ = 200 at time t200 (weak magnetic support).
Current usage metrics show cumulative count of Article Views (full-text article views including HTML views, PDF and ePub downloads, according to the available data) and Abstracts Views on Vision4Press platform.
Data correspond to usage on the plateform after 2015. The current usage metrics is available 48-96 hours after online publication and is updated daily on week days.
Initial download of the metrics may take a while.