Free Access
Fig. 6
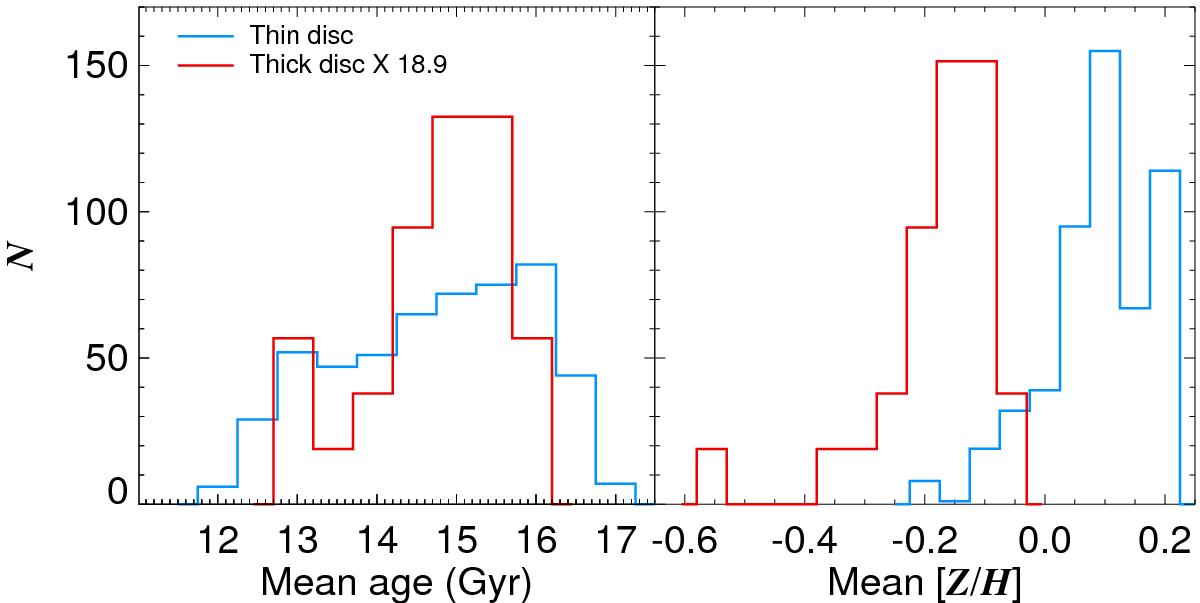
Left: distribution of the mean mass-weighted ages of the thin and thick disc bins (blue and red lines, respectively). Right: distribution of the mean mass-weighted metallicities. The thick disc histograms were multiplied to have the same surface as the thin disc histograms.
Current usage metrics show cumulative count of Article Views (full-text article views including HTML views, PDF and ePub downloads, according to the available data) and Abstracts Views on Vision4Press platform.
Data correspond to usage on the plateform after 2015. The current usage metrics is available 48-96 hours after online publication and is updated daily on week days.
Initial download of the metrics may take a while.