Fig. 2
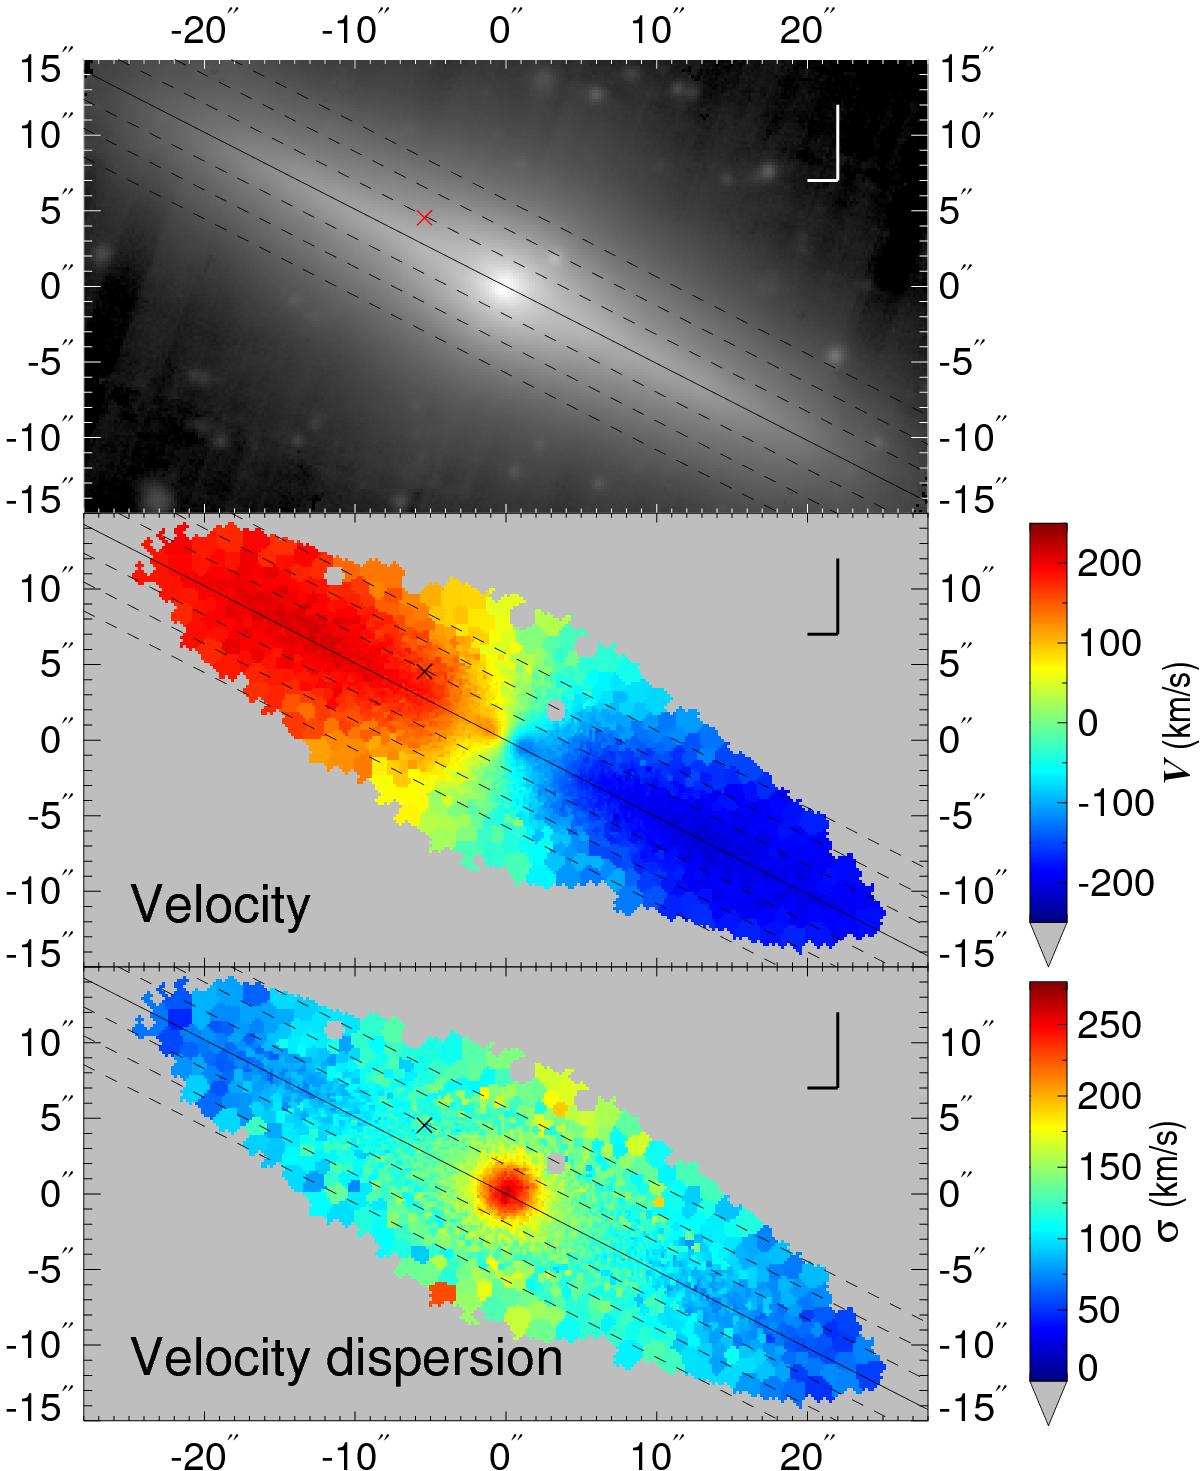
Top: image of ESO 243-49 made by collapsing the MUSE data cube along its spectral direction. Middle: radial velocity map. Bottom: velocity dispersion map. The cross some 7″ to the NE of the centre of the galaxy indicates the location of the X-ray source HLX-1 based on the information in Mapelli et al. (2013). The continuous line indicates the midplane and the dashed lines indicate heights of 0.8, 1.6, and 2.4 kpc above and below the midplane.
Current usage metrics show cumulative count of Article Views (full-text article views including HTML views, PDF and ePub downloads, according to the available data) and Abstracts Views on Vision4Press platform.
Data correspond to usage on the plateform after 2015. The current usage metrics is available 48-96 hours after online publication and is updated daily on week days.
Initial download of the metrics may take a while.